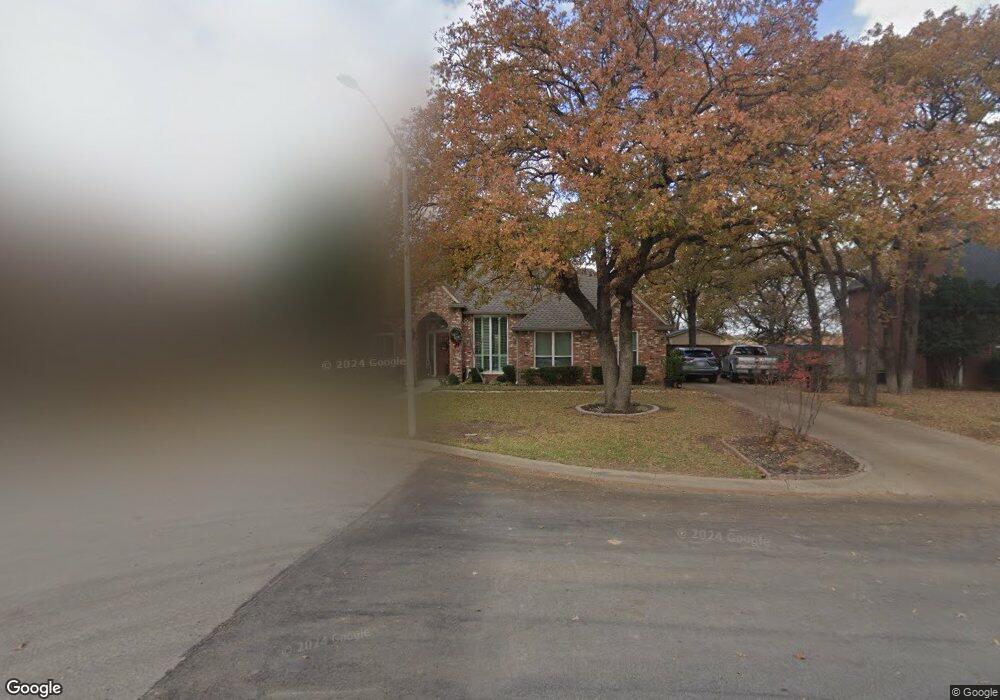
1127 Oakhurst St Denton, TX 76210
South Denton NeighborhoodEstimated Value: $440,000 - $464,000
3
Beds
3
Baths
2,393
Sq Ft
$188/Sq Ft
Est. Value
About This Home
This home is located at 1127 Oakhurst St, Denton, TX 76210 and is currently estimated at $449,912, approximately $188 per square foot. 1127 Oakhurst St is a home located in Denton County with nearby schools including Houston Elementary School, McMath Middle School, and Denton High School.
Ownership History
Date
Name
Owned For
Owner Type
Purchase Details
Closed on
Dec 20, 2018
Sold by
Global Grind Investments Llc
Bought by
Loser Richard G and Loser Charlotte P
Current Estimated Value
Purchase Details
Closed on
Sep 20, 2018
Sold by
Westoplex Renewal Company Llc
Bought by
Global Grind Investments Llc
Home Financials for this Owner
Home Financials are based on the most recent Mortgage that was taken out on this home.
Original Mortgage
$214,900
Interest Rate
4.5%
Mortgage Type
Construction
Purchase Details
Closed on
Oct 31, 1995
Sold by
Jankovich Timothy R and Jankovich Jackie L
Bought by
Jolly David T and Jolly Diane T
Home Financials for this Owner
Home Financials are based on the most recent Mortgage that was taken out on this home.
Original Mortgage
$124,500
Interest Rate
7.58%
Create a Home Valuation Report for This Property
The Home Valuation Report is an in-depth analysis detailing your home's value as well as a comparison with similar homes in the area
Home Values in the Area
Average Home Value in this Area
Purchase History
| Date | Buyer | Sale Price | Title Company |
|---|---|---|---|
| Loser Richard G | -- | Republic Title Of Texas Inc | |
| Global Grind Investments Llc | -- | Alamo Land Title | |
| Westoplex Renewal Company Llc | -- | Alamo Title Company | |
| Jolly David T | -- | -- | |
| Jolly David T | -- | -- |
Source: Public Records
Mortgage History
| Date | Status | Borrower | Loan Amount |
|---|---|---|---|
| Previous Owner | Global Grind Investments Llc | $214,900 | |
| Previous Owner | Jolly David T | $124,500 | |
| Closed | Jolly David T | $24,900 |
Source: Public Records
Tax History Compared to Growth
Tax History
| Year | Tax Paid | Tax Assessment Tax Assessment Total Assessment is a certain percentage of the fair market value that is determined by local assessors to be the total taxable value of land and additions on the property. | Land | Improvement |
|---|---|---|---|---|
| 2025 | $3,341 | $455,713 | $95,541 | $360,172 |
| 2024 | $8,269 | $428,384 | $0 | $0 |
| 2023 | $3,348 | $389,440 | $95,541 | $368,690 |
| 2022 | $7,516 | $354,036 | $82,512 | $310,092 |
| 2021 | $7,155 | $321,851 | $52,113 | $269,738 |
| 2020 | $7,420 | $324,632 | $52,113 | $272,519 |
| 2019 | $7,673 | $321,566 | $52,113 | $269,453 |
| 2018 | $5,660 | $234,285 | $52,113 | $186,344 |
| 2017 | $5,264 | $212,986 | $52,113 | $166,351 |
| 2016 | $4,786 | $193,624 | $32,571 | $161,053 |
| 2015 | $4,185 | $184,961 | $32,571 | $152,390 |
| 2013 | -- | $173,983 | $35,437 | $138,546 |
Source: Public Records
Map
Nearby Homes
- 1108 Ellison Park Cir
- 720 Smokerise Cir
- 2000 Lamprey Cir
- 1012 Indian Ridge Dr
- 2008 Moonsail Ln
- 916 Smokerise Cir
- 2009 Lake Fork Ct
- 3432 Sundown Blvd
- 816 Chapel Dr
- 2209 Loon Lake Rd
- 824 Sandpiper Dr
- 3601 Monte Carlo Ln
- 1313 Lorelei Ln
- 821 Sandpiper Dr
- 1000 Lynhurst Ln
- 2312 Caddo Cir
- 829 Skylark Dr
- 3601 Montecito Dr
- 2409 Loon Lake Rd
- 3612 Granada Trail
- 2906 Oakhurst St
- 1131 Oakhurst St
- 3002 Oakhurst St
- 2909 Destin Dr
- 1126 Oakhurst St
- 2913 Destin Dr
- 1135 Oakhurst St
- 2905 Destin Dr
- 3001 Destin Dr
- 1130 Oakhurst St
- 2901 Destin Dr
- 1132 Oakhurst St
- 3005 Destin Dr
- 3006 Oakhurst St
- 1134 Oakhurst St
- 1139 Oakhurst St
- 3009 Destin Dr
- 1125 Bent Oaks Dr
- 1127 Bent Oaks Dr
- 1121 Sandestin Dr