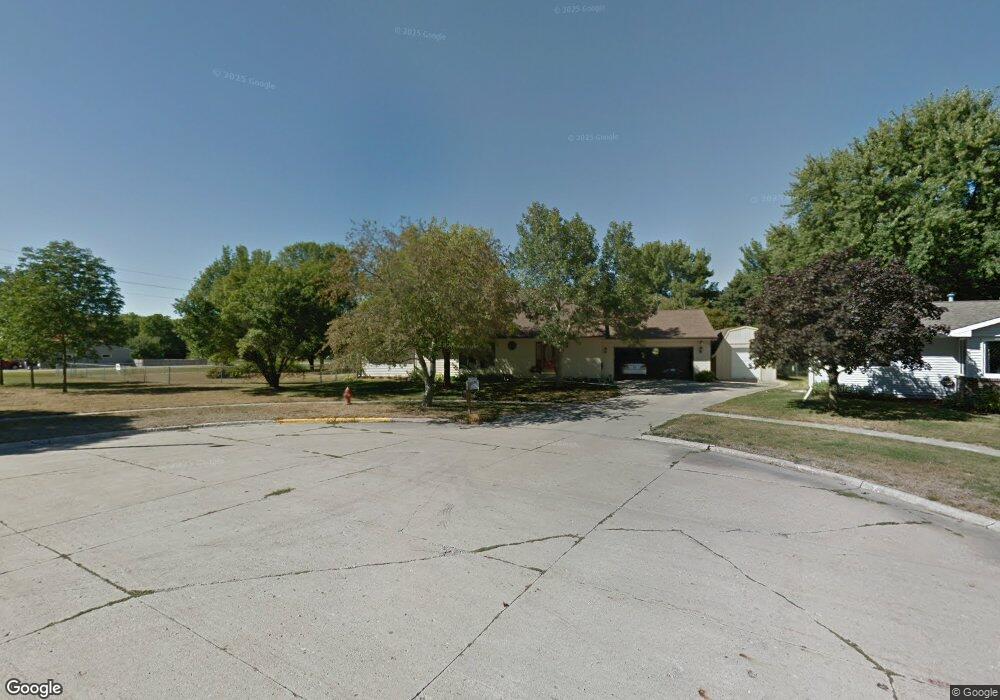
1127 S J Ave Nevada, IA 50201
Estimated Value: $313,000 - $365,000
2
Beds
3
Baths
2,728
Sq Ft
$122/Sq Ft
Est. Value
About This Home
This home is located at 1127 S J Ave, Nevada, IA 50201 and is currently estimated at $334,157, approximately $122 per square foot. 1127 S J Ave is a home located in Story County with nearby schools including Central Elementary School, Nevada Middle School, and Nevada High School.
Ownership History
Date
Name
Owned For
Owner Type
Purchase Details
Closed on
Aug 6, 2015
Sold by
Heintz Larry R
Bought by
Mosinski Michael S and Mosinski Marylin T
Current Estimated Value
Home Financials for this Owner
Home Financials are based on the most recent Mortgage that was taken out on this home.
Original Mortgage
$122,500
Outstanding Balance
$96,542
Interest Rate
4.09%
Mortgage Type
New Conventional
Estimated Equity
$237,615
Create a Home Valuation Report for This Property
The Home Valuation Report is an in-depth analysis detailing your home's value as well as a comparison with similar homes in the area
Home Values in the Area
Average Home Value in this Area
Purchase History
| Date | Buyer | Sale Price | Title Company |
|---|---|---|---|
| Mosinski Michael S | $208,500 | None Available |
Source: Public Records
Mortgage History
| Date | Status | Borrower | Loan Amount |
|---|---|---|---|
| Open | Mosinski Michael S | $122,500 |
Source: Public Records
Tax History Compared to Growth
Tax History
| Year | Tax Paid | Tax Assessment Tax Assessment Total Assessment is a certain percentage of the fair market value that is determined by local assessors to be the total taxable value of land and additions on the property. | Land | Improvement |
|---|---|---|---|---|
| 2025 | $4,470 | $290,000 | $81,100 | $208,900 |
| 2024 | $4,358 | $279,700 | $72,900 | $206,800 |
| 2023 | $4,604 | $279,700 | $72,900 | $206,800 |
| 2022 | $4,560 | $242,900 | $72,900 | $170,000 |
| 2021 | $4,622 | $242,900 | $72,900 | $170,000 |
| 2020 | $4,484 | $232,300 | $64,800 | $167,500 |
| 2019 | $4,484 | $232,300 | $64,800 | $167,500 |
| 2018 | $4,398 | $213,400 | $57,000 | $156,400 |
| 2017 | $4,398 | $213,400 | $57,000 | $156,400 |
| 2016 | $4,426 | $207,700 | $44,700 | $163,000 |
| 2015 | $4,426 | $206,800 | $44,700 | $162,100 |
| 2014 | $4,304 | $206,800 | $44,700 | $162,100 |
Source: Public Records
Map
Nearby Homes