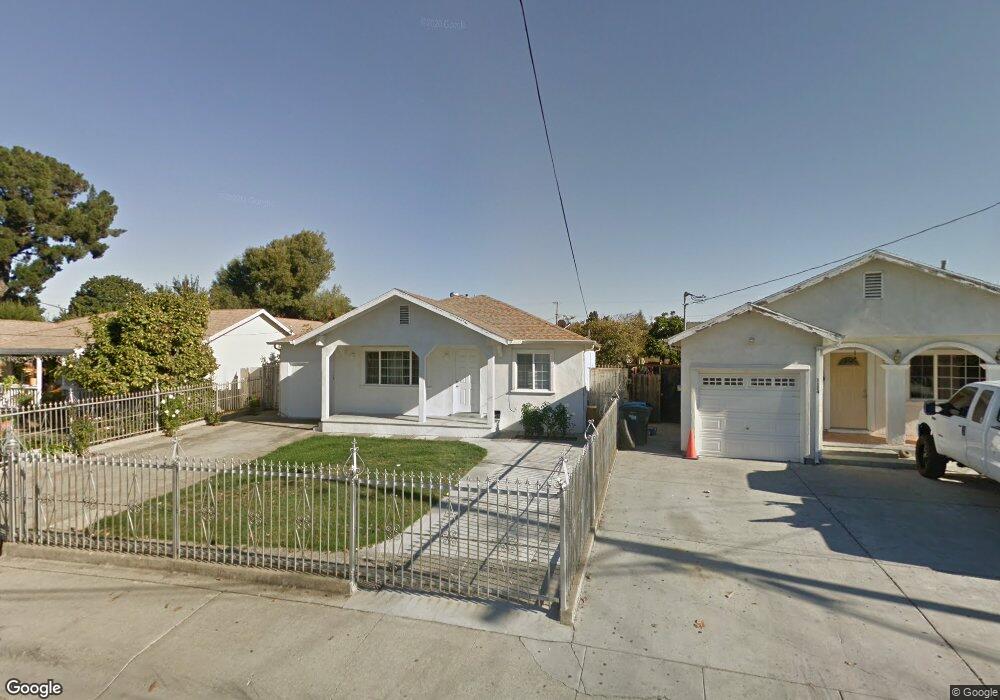
1128 Gaillardia Way East Palo Alto, CA 94303
Estimated Value: $874,000 - $1,135,000
3
Beds
2
Baths
860
Sq Ft
$1,181/Sq Ft
Est. Value
About This Home
This home is located at 1128 Gaillardia Way, East Palo Alto, CA 94303 and is currently estimated at $1,015,750, approximately $1,181 per square foot. 1128 Gaillardia Way is a home located in San Mateo County with nearby schools including Brentwood Academy, Menlo-Atherton High School, and East Palo Alto Academy.
Ownership History
Date
Name
Owned For
Owner Type
Purchase Details
Closed on
Jul 28, 2025
Sold by
Farias Lidia and Polvos Lidia Garcia
Bought by
Lidia Garcia Polvos Revocable Trust and Polvos
Current Estimated Value
Purchase Details
Closed on
Jul 18, 2013
Sold by
Farias Juan and Silva Juan Farias
Bought by
Farias Lidia
Purchase Details
Closed on
May 11, 2004
Sold by
Farias Lidia G and Farias Linda G
Bought by
Farias Lidia G
Home Financials for this Owner
Home Financials are based on the most recent Mortgage that was taken out on this home.
Original Mortgage
$361,250
Interest Rate
5.5%
Mortgage Type
New Conventional
Purchase Details
Closed on
Aug 27, 2003
Sold by
Farias Juan and Farias Lidia
Bought by
Farias Lidia G
Home Financials for this Owner
Home Financials are based on the most recent Mortgage that was taken out on this home.
Original Mortgage
$295,000
Interest Rate
6.7%
Mortgage Type
Purchase Money Mortgage
Create a Home Valuation Report for This Property
The Home Valuation Report is an in-depth analysis detailing your home's value as well as a comparison with similar homes in the area
Home Values in the Area
Average Home Value in this Area
Purchase History
| Date | Buyer | Sale Price | Title Company |
|---|---|---|---|
| Lidia Garcia Polvos Revocable Trust | -- | None Listed On Document | |
| Farias Lidia | -- | None Available | |
| Farias Lidia G | -- | Ticor Title | |
| Farias Lidia G | -- | Alliance Title Company |
Source: Public Records
Mortgage History
| Date | Status | Borrower | Loan Amount |
|---|---|---|---|
| Previous Owner | Farias Lidia G | $361,250 | |
| Previous Owner | Farias Lidia G | $295,000 |
Source: Public Records
Tax History Compared to Growth
Tax History
| Year | Tax Paid | Tax Assessment Tax Assessment Total Assessment is a certain percentage of the fair market value that is determined by local assessors to be the total taxable value of land and additions on the property. | Land | Improvement |
|---|---|---|---|---|
| 2025 | $4,517 | $263,203 | $51,752 | $211,451 |
| 2023 | $4,517 | $252,986 | $49,744 | $203,242 |
| 2022 | $4,152 | $248,026 | $48,769 | $199,257 |
| 2021 | $4,062 | $243,164 | $47,813 | $195,351 |
| 2020 | $3,986 | $240,672 | $47,323 | $193,349 |
| 2019 | $3,991 | $235,954 | $46,396 | $189,558 |
| 2018 | $3,899 | $231,329 | $45,487 | $185,842 |
| 2017 | $3,768 | $226,795 | $44,596 | $182,199 |
| 2016 | $3,776 | $222,349 | $43,722 | $178,627 |
| 2015 | $3,811 | $219,010 | $43,066 | $175,944 |
| 2014 | $3,736 | $214,722 | $42,223 | $172,499 |
Source: Public Records
Map
Nearby Homes
- 956 Mouton Cir
- 120 Gardenia Way
- 1885 E Bayshore Rd Unit 37
- 1885 E Bayshore Rd Unit 71
- 159 Jasmine Way
- 1893 Woodland Ave
- 1879 Woodland Ave
- 1101 Juana Ct
- 1597 Edgewood Dr
- 1982 W Bayshore Rd Unit 121
- 1168 Beech St
- 653 Wildwood Ln
- 1788 E Bayshore Rd
- 2260 Pulgas Ave
- 1038 Runnymede St
- 161 Primrose Way
- 2200 Saint Francis Dr
- 90 Crescent Dr
- 61 Primrose Way
- 1285 Hamilton Ave
- 1124 Gaillardia Way
- 1136 Gaillardia Way
- 275 Verbena Dr
- 1120 Gaillardia Way
- 271 Verbena Dr
- 267 Verbena Dr
- 283 Verbena Dr
- 1111 Gaillardia Way
- 1116 Gaillardia Way
- 1115 Gaillardia Way
- 1140 Gaillardia Way
- 263 Verbena Dr
- 223 Azalia Dr
- 1107 Gaillardia Way
- 1119 Gaillardia Way
- 259 Verbena Dr
- 289 Verbena Dr
- 1112 Gaillardia Way
- 1123 Gaillardia Way
- 1127 Gaillardia Way