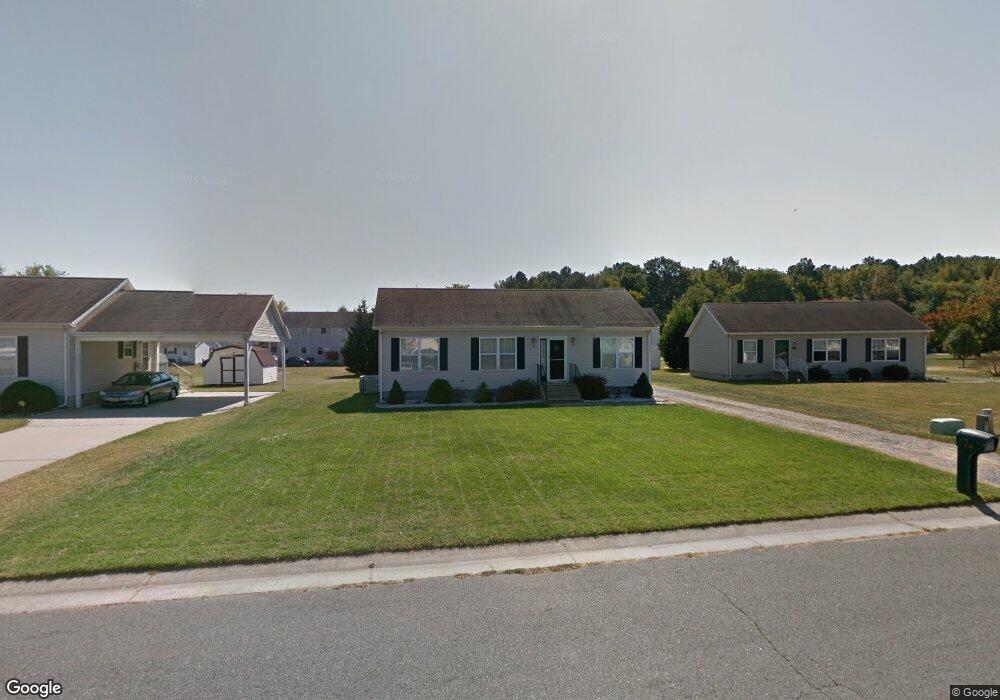
1128 High St Cambridge, MD 21613
Estimated Value: $216,848 - $235,000
--
Bed
2
Baths
1,456
Sq Ft
$157/Sq Ft
Est. Value
About This Home
This home is located at 1128 High St, Cambridge, MD 21613 and is currently estimated at $228,962, approximately $157 per square foot. 1128 High St is a home located in Dorchester County with nearby schools including Choptank Elementary School, Mace's Lane Middle School, and Cambridge-South Dorchester High School.
Ownership History
Date
Name
Owned For
Owner Type
Purchase Details
Closed on
May 31, 2007
Sold by
Jones Percy
Bought by
Jones Percy and Jones Tina
Current Estimated Value
Home Financials for this Owner
Home Financials are based on the most recent Mortgage that was taken out on this home.
Original Mortgage
$148,500
Outstanding Balance
$105,308
Interest Rate
9.37%
Mortgage Type
Stand Alone Refi Refinance Of Original Loan
Estimated Equity
$123,654
Purchase Details
Closed on
May 17, 2007
Sold by
Jones Percy
Bought by
Jones Percy and Jones Tina
Home Financials for this Owner
Home Financials are based on the most recent Mortgage that was taken out on this home.
Original Mortgage
$148,500
Outstanding Balance
$105,308
Interest Rate
9.37%
Mortgage Type
Stand Alone Refi Refinance Of Original Loan
Estimated Equity
$123,654
Purchase Details
Closed on
Oct 26, 2001
Sold by
Bayly Crossing Llc
Bought by
Jones Percy
Create a Home Valuation Report for This Property
The Home Valuation Report is an in-depth analysis detailing your home's value as well as a comparison with similar homes in the area
Home Values in the Area
Average Home Value in this Area
Purchase History
| Date | Buyer | Sale Price | Title Company |
|---|---|---|---|
| Jones Percy | -- | -- | |
| Jones Percy | -- | -- | |
| Jones Percy | $92,500 | -- |
Source: Public Records
Mortgage History
| Date | Status | Borrower | Loan Amount |
|---|---|---|---|
| Open | Jones Percy | $148,500 | |
| Closed | Jones Percy | $148,500 | |
| Closed | Jones Percy | -- |
Source: Public Records
Tax History Compared to Growth
Tax History
| Year | Tax Paid | Tax Assessment Tax Assessment Total Assessment is a certain percentage of the fair market value that is determined by local assessors to be the total taxable value of land and additions on the property. | Land | Improvement |
|---|---|---|---|---|
| 2025 | $2,964 | $181,300 | $16,700 | $164,600 |
| 2024 | $2,629 | $165,900 | $0 | $0 |
| 2023 | $2,629 | $150,500 | $0 | $0 |
| 2022 | $4,994 | $135,100 | $16,700 | $118,400 |
| 2021 | $2,480 | $133,300 | $0 | $0 |
| 2020 | $2,480 | $131,500 | $0 | $0 |
| 2019 | $2,473 | $129,700 | $16,700 | $113,000 |
| 2018 | $2,408 | $129,700 | $16,700 | $113,000 |
| 2017 | $2,408 | $129,700 | $0 | $0 |
| 2016 | -- | $139,400 | $0 | $0 |
| 2015 | -- | $139,400 | $0 | $0 |
| 2014 | -- | $139,400 | $0 | $0 |
Source: Public Records
Map
Nearby Homes
- 1117 High St
- 701 Goldsborough Ave
- 0 E S Rainbow Ave
- 1304 Rainbow Ave
- 0 Bradley Ave
- 824 McBrides Ave
- 1008 Phillips St
- 825 Ames Ct
- 405 Osprey Cir
- 112 Mariners Way
- 374 Robbins Farm Rd
- 120 Mariners Way
- 600 Red Bill Ln
- 128 Mariners Way
- 819 MacEs Ln
- 1606 Osprey Cir
- 802 Allen St
- 909 Pine St
- 810 Washington St
- 0 W S Center St