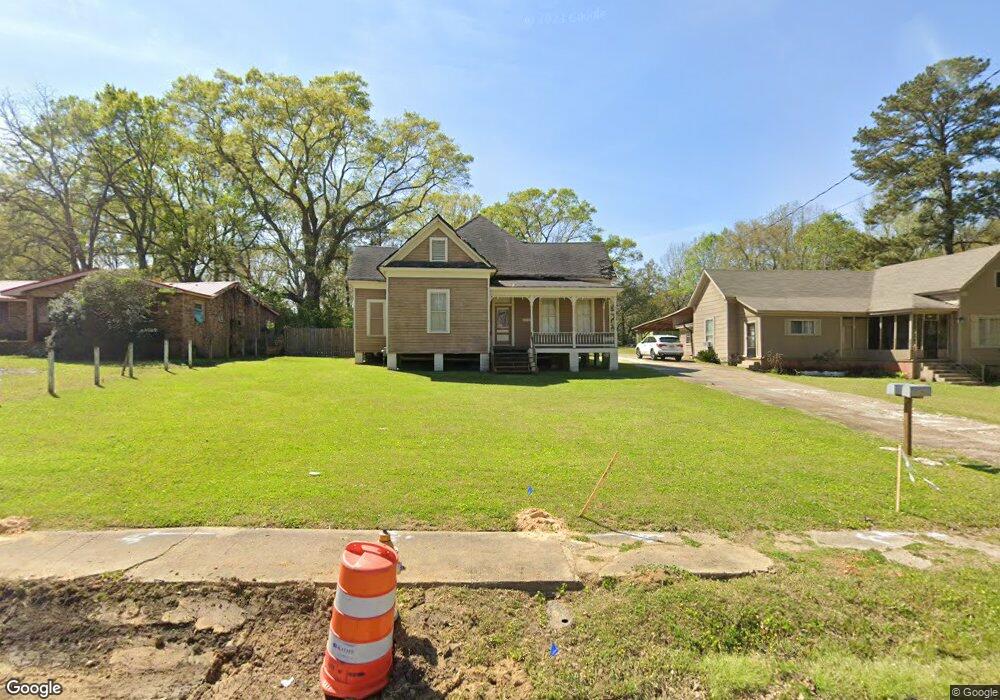
1128 Labranch St McComb, MS 39648
Estimated Value: $74,184 - $104,000
3
Beds
2
Baths
1,616
Sq Ft
$55/Sq Ft
Est. Value
About This Home
This home is located at 1128 Labranch St, McComb, MS 39648 and is currently estimated at $89,546, approximately $55 per square foot. 1128 Labranch St is a home located in Pike County with nearby schools including Higgins Middle School, Otken Elementary School, and Denman Junior High School.
Ownership History
Date
Name
Owned For
Owner Type
Purchase Details
Closed on
Dec 12, 2024
Sold by
Banks Darnis
Bought by
Banks Darnis and Jackson Carol
Current Estimated Value
Purchase Details
Closed on
Sep 3, 2024
Sold by
Banks Darnis
Bought by
Banks Darnis and Jackson Carol
Purchase Details
Closed on
May 17, 2022
Sold by
Wall Stephen D
Bought by
Banks Darnis
Purchase Details
Closed on
Jan 23, 2015
Sold by
Wall Stephen D
Bought by
Gutter Eugene
Purchase Details
Closed on
Jan 3, 2005
Sold by
Banks Nelson and Banks Darnis
Bought by
Wall Stephen D
Create a Home Valuation Report for This Property
The Home Valuation Report is an in-depth analysis detailing your home's value as well as a comparison with similar homes in the area
Purchase History
| Date | Buyer | Sale Price | Title Company |
|---|---|---|---|
| Banks Darnis | -- | None Listed On Document | |
| Banks Darnis | -- | None Listed On Document | |
| Banks Darnis | -- | None Listed On Document | |
| Banks Darnis | -- | None Listed On Document | |
| Gutter Eugene | -- | None Available | |
| Wall Stephen D | -- | None Available |
Source: Public Records
Tax History
| Year | Tax Paid | Tax Assessment Tax Assessment Total Assessment is a certain percentage of the fair market value that is determined by local assessors to be the total taxable value of land and additions on the property. | Land | Improvement |
|---|---|---|---|---|
| 2025 | -- | $3,836 | $0 | $0 |
| 2024 | -- | $3,369 | $0 | $0 |
| 2023 | $441 | $3,352 | $0 | $0 |
| 2022 | $441 | $3,325 | $0 | $0 |
| 2021 | $439 | $3,325 | $0 | $0 |
| 2020 | $422 | $3,190 | $0 | $0 |
| 2019 | $795 | $4,785 | $0 | $0 |
| 2018 | $771 | $4,785 | $0 | $0 |
| 2017 | $385 | $3,190 | $0 | $0 |
| 2016 | $381 | $3,190 | $0 | $0 |
| 2015 | $352 | $2,945 | $0 | $0 |
| 2014 | $352 | $2,945 | $0 | $0 |
| 2013 | -- | $2,945 | $0 | $0 |
Source: Public Records
Map
Nearby Homes
- 7153 US Highway 98
- 00 US Highway 98
- XXX US Highway 98
- 823 Edgar St
- 429 21st St
- 707 Earl St
- 522 2nd St
- 1012 Harper St
- 214 Thompson St
- 710 Beech St
- 425 S Broadway St
- 1047 Lenoir Sellers Rd
- 1043 24th St
- 724 Beech St
- ... W Presley Blvd
- ... Berkshire Ln
- 923 Bendat St
- 703 Pennsylvania Ave
- 200-208 5th Ave
- 415 S 5th St
Your Personal Tour Guide
Ask me questions while you tour the home.