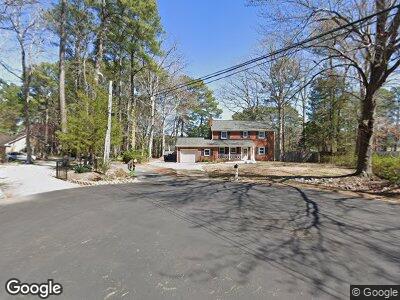
1128 Trantwood Ave Virginia Beach, VA 23454
Great Neck NeighborhoodEstimated Value: $799,000 - $876,504
4
Beds
4
Baths
2,292
Sq Ft
$361/Sq Ft
Est. Value
About This Home
This home is located at 1128 Trantwood Ave, Virginia Beach, VA 23454 and is currently estimated at $827,626, approximately $361 per square foot. 1128 Trantwood Ave is a home located in Virginia Beach City with nearby schools including Trantwood Elementary School, Great Neck Middle School, and Frank W. Cox High School.
Ownership History
Date
Name
Owned For
Owner Type
Purchase Details
Closed on
May 11, 2023
Sold by
Perry Amy K
Bought by
Croxton Stephen Edward and Croxton Yan
Current Estimated Value
Home Financials for this Owner
Home Financials are based on the most recent Mortgage that was taken out on this home.
Original Mortgage
$580,000
Outstanding Balance
$529,877
Interest Rate
5.56%
Mortgage Type
New Conventional
Estimated Equity
$297,749
Purchase Details
Closed on
Sep 22, 2020
Sold by
Perry Jonathan C and Perry Amy K
Bought by
Perry Amy K
Purchase Details
Closed on
Sep 13, 2013
Sold by
Hamrick Cynthia J and Rawlings Mollie F
Bought by
Perry Jonathan C
Home Financials for this Owner
Home Financials are based on the most recent Mortgage that was taken out on this home.
Original Mortgage
$416,250
Interest Rate
4.42%
Mortgage Type
New Conventional
Purchase Details
Closed on
May 5, 2012
Sold by
Hamrick Trustee Cynthia J and Molly Malbon Johnson Revocable Francis Fowler
Bought by
Hamrick Cynthia J and Rawlings Mollie F
Create a Home Valuation Report for This Property
The Home Valuation Report is an in-depth analysis detailing your home's value as well as a comparison with similar homes in the area
Home Values in the Area
Average Home Value in this Area
Purchase History
| Date | Buyer | Sale Price | Title Company |
|---|---|---|---|
| Croxton Stephen Edward | $725,000 | Fidelity National Title | |
| Perry Amy K | -- | None Available | |
| Perry Jonathan C | $555,000 | -- | |
| Hamrick Cynthia J | -- | -- |
Source: Public Records
Mortgage History
| Date | Status | Borrower | Loan Amount |
|---|---|---|---|
| Open | Croxton Stephen Edward | $580,000 | |
| Previous Owner | Perry Jonathan C | $416,250 |
Source: Public Records
Tax History Compared to Growth
Tax History
| Year | Tax Paid | Tax Assessment Tax Assessment Total Assessment is a certain percentage of the fair market value that is determined by local assessors to be the total taxable value of land and additions on the property. | Land | Improvement |
|---|---|---|---|---|
| 2024 | $6,967 | $718,200 | $430,500 | $287,700 |
| 2023 | $6,021 | $608,200 | $420,000 | $188,200 |
| 2022 | $5,243 | $529,600 | $346,500 | $183,100 |
| 2021 | $5,238 | $529,100 | $356,000 | $173,100 |
| 2020 | $5,245 | $515,500 | $340,000 | $175,500 |
| 2019 | $5,172 | $521,300 | $340,000 | $181,300 |
| 2018 | $5,226 | $521,300 | $340,000 | $181,300 |
| 2017 | $5,097 | $508,400 | $332,000 | $176,400 |
| 2016 | $5,041 | $509,200 | $332,000 | $177,200 |
| 2015 | $4,701 | $474,800 | $332,000 | $142,800 |
| 2014 | $4,367 | $496,900 | $360,000 | $136,900 |
Source: Public Records
Map
Nearby Homes
- 1125 Blackburn Ln
- 1288 Holly Point Rd
- 2440 Laurel Cove Dr
- 909 General Beauregard Dr
- 2705 Hood Cir
- 2429 Plantation Dr
- 936 Duke of Suffolk Dr
- 2300 Plantation Dr
- 812 Earl of Chesterfield Ln
- 2134 Advent Ct
- 1314 Victorian Crescent
- 2124 Advent Ct
- 2156 Refuge Ct
- 2706 Windship Point
- 1956 Sandee Crescent
- 2112 Saint Marshall Dr
- 2557 Torrey Place
- 2741 River Rd
- 2216 Wolfsnare Rd
- 1033 Collection Creek Way