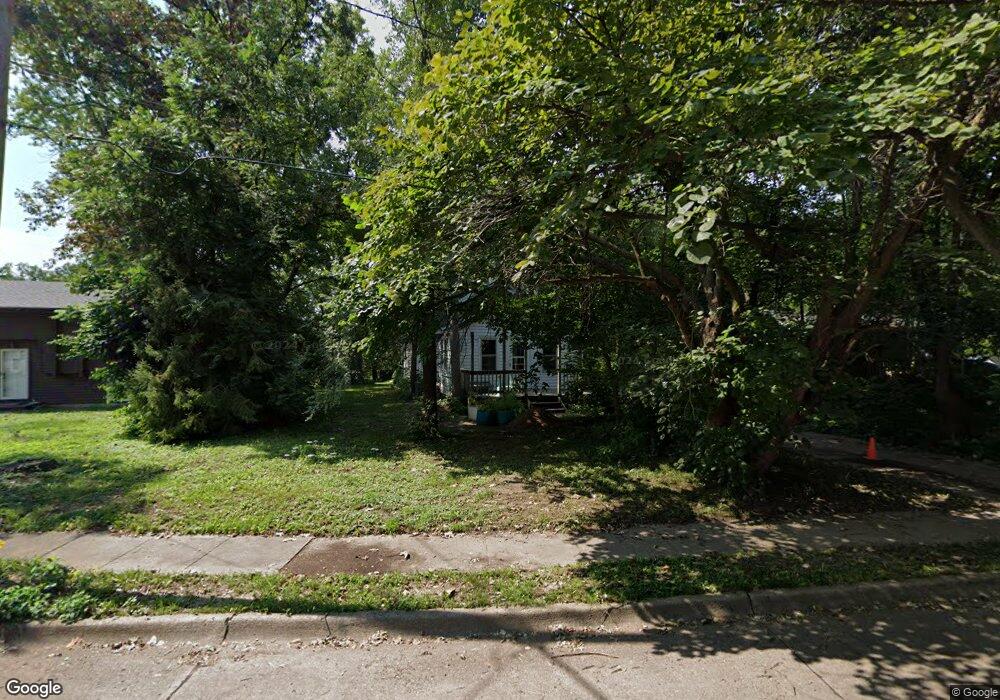
1128 Walnut St West Des Moines, IA 50265
Estimated Value: $177,000 - $194,306
2
Beds
1
Bath
805
Sq Ft
$231/Sq Ft
Est. Value
About This Home
This home is located at 1128 Walnut St, West Des Moines, IA 50265 and is currently estimated at $185,827, approximately $230 per square foot. 1128 Walnut St is a home located in Polk County with nearby schools including Hillside Elementary School, Stilwell Junior High School, and Valley Southwoods Freshman High School.
Ownership History
Date
Name
Owned For
Owner Type
Purchase Details
Closed on
Apr 26, 2022
Sold by
Reuss Lindsey S
Bought by
Reuss William G
Current Estimated Value
Home Financials for this Owner
Home Financials are based on the most recent Mortgage that was taken out on this home.
Original Mortgage
$65,000
Outstanding Balance
$60,893
Interest Rate
4.16%
Mortgage Type
New Conventional
Estimated Equity
$124,934
Purchase Details
Closed on
Nov 1, 2004
Sold by
Fuller Betty Jean
Bought by
Reuss William G and Reuss Lindsey S
Home Financials for this Owner
Home Financials are based on the most recent Mortgage that was taken out on this home.
Original Mortgage
$86,400
Interest Rate
5.81%
Mortgage Type
Purchase Money Mortgage
Purchase Details
Closed on
Apr 12, 2004
Sold by
Reuss William G and Reuss Lindsey S
Bought by
Reuss William G and Reuss Lindsey S
Purchase Details
Closed on
Mar 14, 1997
Sold by
Cuomo Andrew M
Bought by
Reuss William G
Home Financials for this Owner
Home Financials are based on the most recent Mortgage that was taken out on this home.
Original Mortgage
$45,705
Interest Rate
7.73%
Mortgage Type
FHA
Purchase Details
Closed on
Nov 22, 1996
Sold by
Rice Bob E
Bought by
Hud
Create a Home Valuation Report for This Property
The Home Valuation Report is an in-depth analysis detailing your home's value as well as a comparison with similar homes in the area
Home Values in the Area
Average Home Value in this Area
Purchase History
| Date | Buyer | Sale Price | Title Company |
|---|---|---|---|
| Reuss William G | -- | None Listed On Document | |
| Reuss William G | -- | None Listed On Document | |
| Reuss William G | $99,500 | -- | |
| Reuss William G | -- | -- | |
| Reuss William G | -- | -- | |
| Hud | $43,238 | -- |
Source: Public Records
Mortgage History
| Date | Status | Borrower | Loan Amount |
|---|---|---|---|
| Open | Reuss William G | $65,000 | |
| Closed | Reuss William G | $65,000 | |
| Previous Owner | Reuss William G | $86,400 | |
| Previous Owner | Reuss William G | $45,705 |
Source: Public Records
Tax History Compared to Growth
Tax History
| Year | Tax Paid | Tax Assessment Tax Assessment Total Assessment is a certain percentage of the fair market value that is determined by local assessors to be the total taxable value of land and additions on the property. | Land | Improvement |
|---|---|---|---|---|
| 2025 | $2,000 | $138,400 | $67,300 | $71,100 |
| 2024 | $2,000 | $126,200 | $61,300 | $64,900 |
| 2023 | $2,538 | $126,200 | $61,300 | $64,900 |
| 2022 | $2,508 | $131,400 | $75,500 | $55,900 |
| 2021 | $2,386 | $131,400 | $75,500 | $55,900 |
| 2020 | $2,350 | $119,000 | $68,700 | $50,300 |
| 2019 | $2,238 | $119,000 | $68,700 | $50,300 |
| 2018 | $2,242 | $109,200 | $60,100 | $49,100 |
| 2017 | $2,122 | $109,200 | $60,100 | $49,100 |
| 2016 | $2,076 | $100,400 | $55,100 | $45,300 |
| 2015 | $2,076 | $100,400 | $55,100 | $45,300 |
| 2014 | $1,972 | $94,300 | $51,500 | $42,800 |
Source: Public Records
Map
Nearby Homes