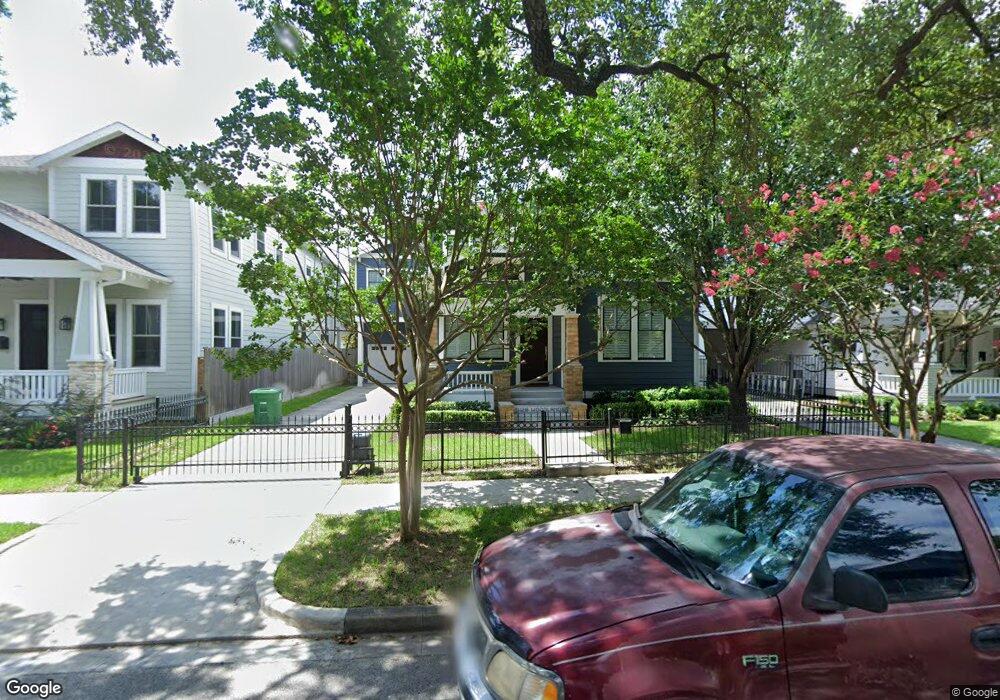
1128 Woodland St Houston, TX 77009
Greater Heights NeighborhoodEstimated Value: $1,497,000 - $1,767,000
4
Beds
4
Baths
3,190
Sq Ft
$498/Sq Ft
Est. Value
About This Home
This home is located at 1128 Woodland St, Houston, TX 77009 and is currently estimated at $1,587,613, approximately $497 per square foot. 1128 Woodland St is a home located in Harris County with nearby schools including Travis Elementary School, Hogg Middle, and Heights High School.
Ownership History
Date
Name
Owned For
Owner Type
Purchase Details
Closed on
Nov 8, 2023
Sold by
Schilling Carson E
Bought by
Warner Jeffery D
Current Estimated Value
Purchase Details
Closed on
Jul 23, 2015
Sold by
Some Odd Investors Llc
Bought by
Warner Jeffery and Schilling Alyssa
Home Financials for this Owner
Home Financials are based on the most recent Mortgage that was taken out on this home.
Original Mortgage
$651,000
Interest Rate
4.08%
Mortgage Type
New Conventional
Purchase Details
Closed on
Jul 30, 2014
Sold by
Derby Virginia A and Derby William D
Bought by
Some Odd Investors Llc
Home Financials for this Owner
Home Financials are based on the most recent Mortgage that was taken out on this home.
Original Mortgage
$637,000
Interest Rate
4.2%
Mortgage Type
New Conventional
Purchase Details
Closed on
Jul 20, 1998
Sold by
Derby Kathryn Hermina
Bought by
Derby William D and Derby Virginia A
Home Financials for this Owner
Home Financials are based on the most recent Mortgage that was taken out on this home.
Original Mortgage
$89,997
Interest Rate
7.05%
Mortgage Type
VA
Create a Home Valuation Report for This Property
The Home Valuation Report is an in-depth analysis detailing your home's value as well as a comparison with similar homes in the area
Home Values in the Area
Average Home Value in this Area
Purchase History
| Date | Buyer | Sale Price | Title Company |
|---|---|---|---|
| Warner Jeffery D | -- | None Listed On Document | |
| Warner Jeffery | -- | Fidelity National Title | |
| Some Odd Investors Llc | -- | -- | |
| Some Odd Investors Llc | -- | -- | |
| Derby William D | -- | Stewart Title |
Source: Public Records
Mortgage History
| Date | Status | Borrower | Loan Amount |
|---|---|---|---|
| Previous Owner | Warner Jeffery | $651,000 | |
| Previous Owner | Some Odd Investors Llc | $637,000 | |
| Previous Owner | Derby William D | $89,997 |
Source: Public Records
Tax History Compared to Growth
Tax History
| Year | Tax Paid | Tax Assessment Tax Assessment Total Assessment is a certain percentage of the fair market value that is determined by local assessors to be the total taxable value of land and additions on the property. | Land | Improvement |
|---|---|---|---|---|
| 2025 | $22,755 | $1,486,651 | $525,000 | $961,651 |
| 2024 | $22,755 | $1,408,883 | $525,000 | $883,883 |
| 2023 | $22,755 | $1,487,211 | $475,000 | $1,012,211 |
| 2022 | $26,729 | $1,213,909 | $475,000 | $738,909 |
| 2021 | $26,859 | $1,152,407 | $450,000 | $702,407 |
| 2020 | $27,109 | $1,119,470 | $450,000 | $669,470 |
| 2019 | $26,358 | $1,041,617 | $425,000 | $616,617 |
| 2018 | $20,509 | $1,022,943 | $350,000 | $672,943 |
| 2017 | $25,866 | $1,022,943 | $350,000 | $672,943 |
| 2016 | $26,550 | $1,050,000 | $350,000 | $700,000 |
| 2015 | $5,784 | $300,000 | $300,000 | $0 |
| 2014 | $5,784 | $368,258 | $300,000 | $68,258 |
Source: Public Records
Map
Nearby Homes
- 1023 Euclid St
- 1033 Highland St
- 1001 E 7th 1/2 St
- 729 E 9th St
- 701 E 8th St
- 2928 Michaux St
- 2916 Michaux St
- 726 E 7th St
- 922 Bayland Ave
- 716 E 10th St
- 909 Bayland Ave
- 931 Merrill St
- 2519 White Oak Dr
- 643 E 10th St
- 1125 Usener St
- 636 E 6 1 2 St
- 2434 White Oak Dr
- 3541 Michaux St
- 515 E 9th St
- 825 Merrill St
- 1132 Woodland St
- 1124 Woodland St
- 1124 Woodland St Unit G
- 1125 Euclid St Unit 3
- 1125 Euclid St Unit 2
- 1120 Woodland St
- 1136 Woodland St
- 1129 Euclid St
- 1123 Euclid St
- 1119 Euclid St
- 1131 Euclid St
- 1116 Woodland St
- 1127 Woodland St
- 1129 Woodland St
- 1123 Woodland St
- 1109 Euclid St
- 1112 Woodland St
- 1117 Woodland St
- 1135 Woodland St Unit A
- 1135 Woodland St Unit B