Estimated Value: $120,104 - $198,000
3
Beds
2
Baths
1,300
Sq Ft
$122/Sq Ft
Est. Value
About This Home
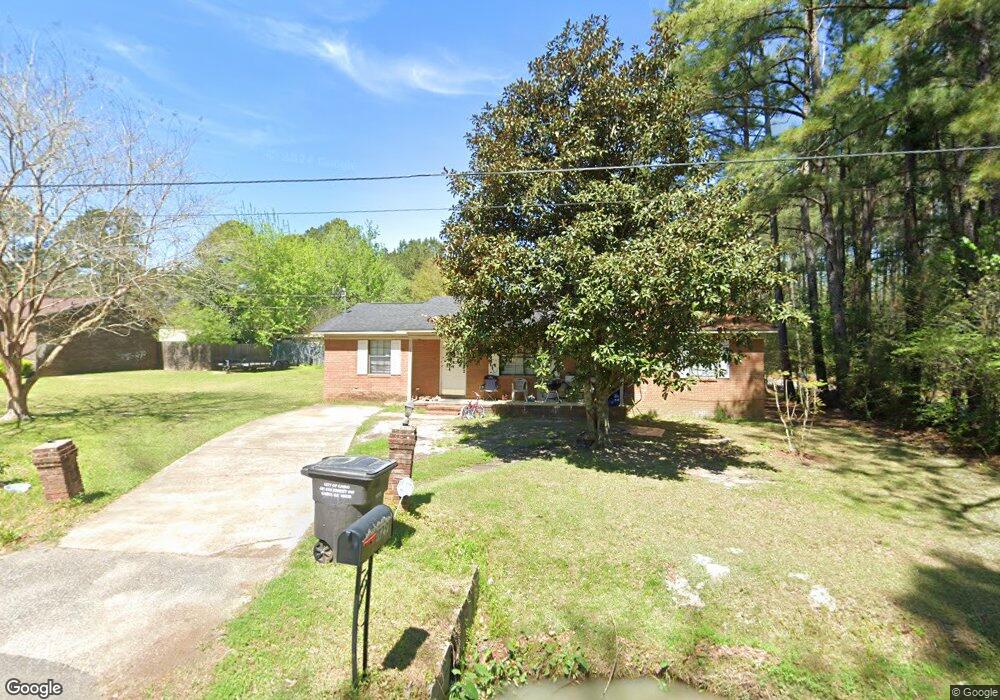
This home is located at 1129 10th Ave NE, Cairo, GA 39828 and is currently estimated at $159,026, approximately $122 per square foot. 1129 10th Ave NE is a home located in Grady County with nearby schools including Cairo High School.
Ownership History
Date
Name
Owned For
Owner Type
Purchase Details
Closed on
Dec 11, 2017
Sold by
King John Cameron
Bought by
Royal Remnant Properties Llc
Current Estimated Value
Purchase Details
Closed on
May 3, 2007
Sold by
Chase Home Finance Llc
Bought by
King John Cameron and King Rachel A
Home Financials for this Owner
Home Financials are based on the most recent Mortgage that was taken out on this home.
Original Mortgage
$40,294
Interest Rate
6.12%
Mortgage Type
New Conventional
Purchase Details
Closed on
Nov 7, 2006
Sold by
Battle Annette M
Bought by
Chase Home Finance Llc
Purchase Details
Closed on
Apr 24, 1997
Sold by
Tandem Dev Inc
Bought by
Battle Annette M
Purchase Details
Closed on
Jan 31, 1997
Sold by
Battle Terry
Bought by
Tandem Dev Inc
Purchase Details
Closed on
Sep 27, 1995
Sold by
Tandem Dev Inc
Bought by
Battle Terry
Create a Home Valuation Report for This Property
The Home Valuation Report is an in-depth analysis detailing your home's value as well as a comparison with similar homes in the area
Purchase History
| Date | Buyer | Sale Price | Title Company |
|---|---|---|---|
| Royal Remnant Properties Llc | $88,680 | -- | |
| King John Cameron | $47,405 | -- | |
| Chase Home Finance Llc | $53,125 | -- | |
| Battle Annette M | $57,000 | -- | |
| Tandem Dev Inc | -- | -- | |
| Battle Terry | $51,500 | -- |
Source: Public Records
Mortgage History
| Date | Status | Borrower | Loan Amount |
|---|---|---|---|
| Previous Owner | King John Cameron | $40,294 |
Source: Public Records
Tax History
| Year | Tax Paid | Tax Assessment Tax Assessment Total Assessment is a certain percentage of the fair market value that is determined by local assessors to be the total taxable value of land and additions on the property. | Land | Improvement |
|---|---|---|---|---|
| 2024 | $1,260 | $37,514 | $1,920 | $35,594 |
| 2023 | $1,313 | $35,472 | $3,400 | $32,072 |
| 2022 | $1,366 | $35,472 | $3,400 | $32,072 |
| 2021 | $1,369 | $35,472 | $3,400 | $32,072 |
| 2020 | $1,373 | $35,472 | $3,400 | $32,072 |
| 2019 | $1,373 | $35,472 | $3,400 | $32,072 |
| 2018 | $1,305 | $35,472 | $3,400 | $32,072 |
| 2017 | $1,255 | $35,472 | $3,400 | $32,072 |
| 2016 | $1,072 | $29,637 | $3,400 | $26,237 |
| 2015 | $1,062 | $29,637 | $3,400 | $26,237 |
| 2014 | $1,062 | $29,637 | $3,400 | $26,237 |
| 2013 | -- | $25,561 | $3,400 | $22,161 |
Source: Public Records
Map
Nearby Homes
- 408 Bay Tree Rd NE
- 711 2nd Ave NE
- 0 20th St NE
- 00 20th St NE
- 2975 U S 84
- 00 Blackberry Ln
- 00 Meridian Rd
- Lot #15, 3 64 Acres Oakbend Cir
- 00 State Route 188
- 0 State Route 188
- 4761 Hadley Ferry Rd
- 66 22nd St NE
- 112 9th Ave NW
- 125 6th Ave NW
- 00 00 Hwy 111 South Tract 2
- 309 3rd St SE
- 220 8th Ave NW
- 1420 Parallel Dr NW
- 00 Hwy 111 South Tract 1
- X 1st St
- 1125 10th Ave NE
- 1009 12th St NE
- 1121 11th St NE
- 1104 10th Ave NE
- 1112 10th Ave NE
- 1131 11th St NE
- 1013 12th St NE
- 1133 11th St NE
- 1017 12th St NE
- 1137 11th St NE
- 1099 10th Ave NE
- 1141 11th St NE
- 1021 12th St NE
- 1069 10th Ave NE
- 1145 11th St NE
- 1097 Bondvilla Dr
- 1039 10th Ave NE
- 1025 12th St NE
- 1037 10th Ave NE
- 1096 11th Ave NE
Your Personal Tour Guide
Ask me questions while you tour the home.