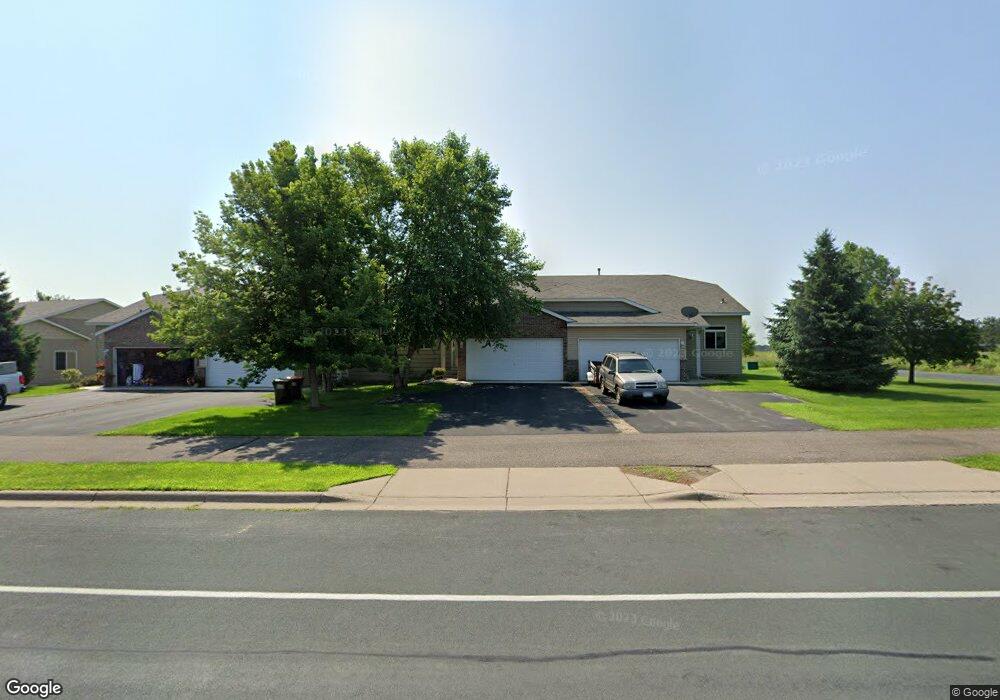
1129 36th St W Hastings, MN 55033
Hastings-Marshan Township NeighborhoodEstimated Value: $271,725 - $289,000
3
Beds
2
Baths
1,606
Sq Ft
$174/Sq Ft
Est. Value
About This Home
This home is located at 1129 36th St W, Hastings, MN 55033 and is currently estimated at $279,181, approximately $173 per square foot. 1129 36th St W is a home located in Dakota County with nearby schools including Hastings Middle School, Christa Mcauliffe Elementary School, and Hastings High School.
Ownership History
Date
Name
Owned For
Owner Type
Purchase Details
Closed on
Jun 26, 2020
Sold by
Kidd Kelly M
Bought by
Lindberg Christine Joan
Current Estimated Value
Home Financials for this Owner
Home Financials are based on the most recent Mortgage that was taken out on this home.
Original Mortgage
$213,400
Outstanding Balance
$189,229
Interest Rate
3.1%
Mortgage Type
New Conventional
Estimated Equity
$89,952
Purchase Details
Closed on
May 21, 2014
Sold by
Zauner Laura
Bought by
Kidd Kelly M
Home Financials for this Owner
Home Financials are based on the most recent Mortgage that was taken out on this home.
Original Mortgage
$137,450
Interest Rate
3.75%
Mortgage Type
FHA
Purchase Details
Closed on
Jan 7, 2009
Sold by
Emc Mortgage Corp
Bought by
Not Provided
Home Financials for this Owner
Home Financials are based on the most recent Mortgage that was taken out on this home.
Original Mortgage
$88,200
Interest Rate
4.85%
Mortgage Type
New Conventional
Purchase Details
Closed on
Dec 16, 2005
Sold by
Mw Johnson Construction Inc
Bought by
Landeau Jean and Landeau Rick
Purchase Details
Closed on
Jan 16, 2004
Sold by
Advanced Homes Of Hastings Inc
Bought by
M W Johnson Construction Inc
Create a Home Valuation Report for This Property
The Home Valuation Report is an in-depth analysis detailing your home's value as well as a comparison with similar homes in the area
Home Values in the Area
Average Home Value in this Area
Purchase History
| Date | Buyer | Sale Price | Title Company |
|---|---|---|---|
| Lindberg Christine Joan | $220,000 | Dca Title | |
| Kidd Kelly M | $140,000 | Edina Realty Title Inc | |
| Not Provided | $110,250 | -- | |
| Landeau Jean | $170,000 | -- | |
| M W Johnson Construction Inc | $945,000 | -- |
Source: Public Records
Mortgage History
| Date | Status | Borrower | Loan Amount |
|---|---|---|---|
| Open | Lindberg Christine Joan | $213,400 | |
| Previous Owner | Kidd Kelly M | $137,450 | |
| Previous Owner | Not Provided | $88,200 |
Source: Public Records
Tax History Compared to Growth
Tax History
| Year | Tax Paid | Tax Assessment Tax Assessment Total Assessment is a certain percentage of the fair market value that is determined by local assessors to be the total taxable value of land and additions on the property. | Land | Improvement |
|---|---|---|---|---|
| 2024 | $2,798 | $235,900 | $44,600 | $191,300 |
| 2023 | $2,798 | $242,300 | $44,400 | $197,900 |
| 2022 | $2,418 | $235,100 | $44,300 | $190,800 |
| 2021 | $1,974 | $196,400 | $38,500 | $157,900 |
| 2020 | $1,922 | $176,600 | $36,700 | $139,900 |
| 2019 | $1,755 | $167,700 | $34,900 | $132,800 |
| 2018 | $1,744 | $148,900 | $33,200 | $115,700 |
| 2017 | $1,586 | $144,100 | $31,700 | $112,400 |
| 2016 | $1,554 | $133,500 | $29,600 | $103,900 |
| 2015 | $1,181 | $103,043 | $22,818 | $80,225 |
| 2014 | -- | $77,319 | $20,010 | $57,309 |
| 2013 | -- | $64,457 | $16,511 | $47,946 |
Source: Public Records
Map
Nearby Homes
- 753 Greten Ln
- 782 31st St W
- 664 35th St W
- 456 Hayes Dr Unit 59
- 2970 Highview Knolls
- 379 Frederick Cir Unit 905
- 313 Frederick Cir Unit 106
- 1780 River Shore Dr
- 3525 Vermillion St
- 3575 Vermillion St
- 1595 River Shore Dr
- 2309 Old Bridge Ln
- 531 Tiffany Dr
- 1730 River Shore Dr
- 2000 Forest St
- 2310 Old Bridge Ln
- Promenade III Plan at Villas at Pleasant
- Portico Plan at Villas at Pleasant
- Palazzo Plan at Villas at Pleasant
- 2289 Old Bridge Ln
- 1129 1129 36th-Street-w
- 1125 36th St W
- 1133 1133 36th-Street-w
- 1133 36th St W
- 1121 36th St W
- 1121 1121 36th-Street-w
- 1115 36th St W
- 1111 36th St W
- 1107 36th St W
- 3569 Village Trail
- 1103 36th St W
- 3563 Village Trail
- 3594 Village Trail
- 3557 Village Trail
- 1075 36th St W
- 3578 Village Trail
- 1071 36th St W
- 1143 36th St W
- 3551 Village Trail
- 3597 Village Way