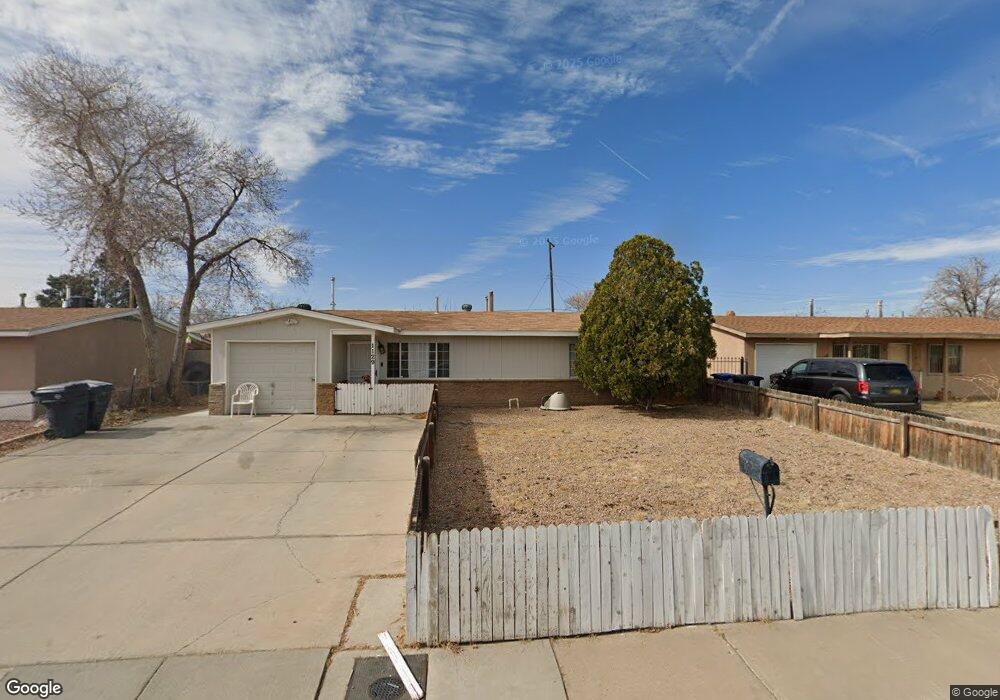
1129 Carlos Rey Dr SW Albuquerque, NM 87121
Southwest Heights NeighborhoodEstimated Value: $224,000 - $285,000
3
Beds
1
Bath
1,100
Sq Ft
$225/Sq Ft
Est. Value
About This Home
This home is located at 1129 Carlos Rey Dr SW, Albuquerque, NM 87121 and is currently estimated at $248,002, approximately $225 per square foot. 1129 Carlos Rey Dr SW is a home located in Bernalillo County with nearby schools including Alamosa Elementary School, Truman Middle School, and West Mesa High School.
Ownership History
Date
Name
Owned For
Owner Type
Purchase Details
Closed on
Sep 29, 2020
Sold by
Transform 505 Inc
Bought by
Delgado Alvear Adilene
Current Estimated Value
Home Financials for this Owner
Home Financials are based on the most recent Mortgage that was taken out on this home.
Original Mortgage
$133,536
Outstanding Balance
$118,504
Interest Rate
2.9%
Mortgage Type
FHA
Estimated Equity
$129,498
Purchase Details
Closed on
May 8, 2020
Sold by
M & M Future Investments Llc
Bought by
Transform 505 Inc
Purchase Details
Closed on
Jul 19, 2002
Sold by
Davis James C and Davis Mary C
Bought by
Cameron Allen
Home Financials for this Owner
Home Financials are based on the most recent Mortgage that was taken out on this home.
Original Mortgage
$66,400
Interest Rate
6.69%
Mortgage Type
Balloon
Create a Home Valuation Report for This Property
The Home Valuation Report is an in-depth analysis detailing your home's value as well as a comparison with similar homes in the area
Home Values in the Area
Average Home Value in this Area
Purchase History
| Date | Buyer | Sale Price | Title Company |
|---|---|---|---|
| Delgado Alvear Adilene | -- | Fidelity National Ttl Ins Co | |
| Transform 505 Inc | -- | None Available | |
| Cameron Allen | -- | Fidelity National Title Ins |
Source: Public Records
Mortgage History
| Date | Status | Borrower | Loan Amount |
|---|---|---|---|
| Open | Delgado Alvear Adilene | $133,536 | |
| Previous Owner | Cameron Allen | $66,400 | |
| Closed | Cameron Allen | $16,600 |
Source: Public Records
Tax History Compared to Growth
Tax History
| Year | Tax Paid | Tax Assessment Tax Assessment Total Assessment is a certain percentage of the fair market value that is determined by local assessors to be the total taxable value of land and additions on the property. | Land | Improvement |
|---|---|---|---|---|
| 2025 | $1,509 | $38,900 | $8,365 | $30,535 |
| 2024 | $1,509 | $37,768 | $8,122 | $29,646 |
| 2023 | $1,481 | $36,668 | $7,885 | $28,783 |
| 2022 | $1,429 | $35,601 | $7,656 | $27,945 |
| 2021 | $1,379 | $34,564 | $7,433 | $27,131 |
| 2020 | $1,044 | $24,329 | $8,122 | $16,207 |
| 2019 | $1,013 | $23,620 | $7,885 | $15,735 |
| 2018 | $977 | $23,620 | $7,885 | $15,735 |
| 2017 | $947 | $22,933 | $7,656 | $15,277 |
| 2016 | $956 | $22,465 | $7,433 | $15,032 |
| 2015 | $22,465 | $22,465 | $7,433 | $15,032 |
| 2014 | $928 | $21,853 | $7,695 | $14,158 |
| 2013 | -- | $21,217 | $7,471 | $13,746 |
Source: Public Records
Map
Nearby Homes
- 5948 Carlos Rey Cir SW
- 6436 Trujillo Rd SW
- 6208 Gonzales Rd SW
- 420 65th St SW
- 618 Dolores Dr SW
- 412 63rd St SW
- 420 69th St SW
- 714 City View Dr SW
- 305 56th St SW
- 721 Foothill Dr SW Unit A
- 5308 White Reserve Ave SW
- 5301 Los Abuelos Ct SW
- 632 Escavada St SW
- 135 57th St SW
- 513 53rd St SW
- 5613 Central Ave NW
- 1116 Santander St SW
- 0 Bridge Blvd SW
- Payson Plan at Villa De Marcos Gabriel
- 140 65th St NW
- 1133 Carlos Rey Dr SW
- 1125 Carlos Rey Dr SW
- 1137 Carlos Rey Dr SW
- 1121 Carlos Rey Dr SW
- 5958 Carlos Rey Cir SW
- 1132 Yerba Rd SW
- 1124 Yerba Rd SW
- 1128 Yerba Rd SW
- 1141 Carlos Rey Dr SW
- 1136 Yerba Rd SW
- 5954 Carlos Rey Cir SW
- 1136 Carlos Rey Dr SW
- 1119 Carlos Rey Dr SW
- 1120 Yerba Rd SW
- 1140 Yerba Rd SW
- 1145 Carlos Rey Dr SW
- 5965 Carlos Rey Cir SW
- 1116 Yerba Rd SW
- 5957 Eucariz Ave SW
- 0 Carlos Rey Cir SW Unit 48567