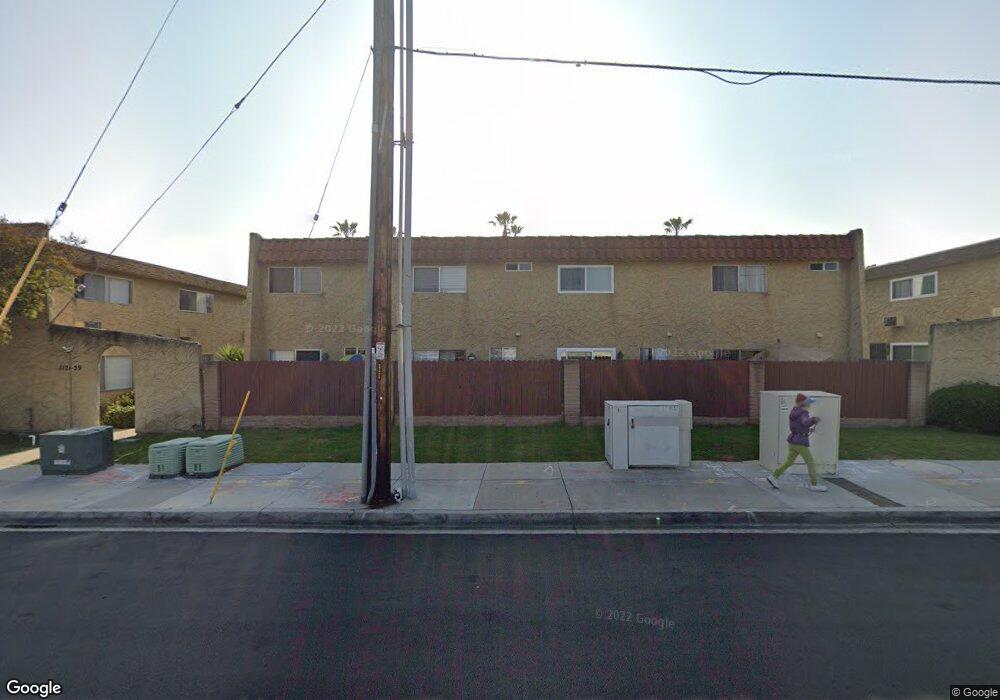
1129 Emerald Ave Unit 5 El Cajon, CA 92020
Estimated Value: $401,000 - $458,000
2
Beds
2
Baths
1,024
Sq Ft
$425/Sq Ft
Est. Value
About This Home
This home is located at 1129 Emerald Ave Unit 5, El Cajon, CA 92020 and is currently estimated at $435,689, approximately $425 per square foot. 1129 Emerald Ave Unit 5 is a home located in San Diego County with nearby schools including Chase Avenue Elementary School, Cajon Valley Middle School, and Bostonia Global High School.
Ownership History
Date
Name
Owned For
Owner Type
Purchase Details
Closed on
May 14, 2015
Sold by
Young Daryl and Young Carmen
Bought by
Frangool Dina
Current Estimated Value
Purchase Details
Closed on
Jan 14, 2004
Sold by
Baugh Wesley Allen and Baugh Helen
Bought by
Young Daryl and Young Carmen
Home Financials for this Owner
Home Financials are based on the most recent Mortgage that was taken out on this home.
Original Mortgage
$151,200
Interest Rate
6.5%
Mortgage Type
Purchase Money Mortgage
Purchase Details
Closed on
Aug 11, 1995
Sold by
J Sheldon White Inc and Baugh Wesley Allen
Bought by
Baugh Wesley Allen and Pacific Coast Funding
Purchase Details
Closed on
Mar 25, 1992
Purchase Details
Closed on
Feb 12, 1992
Purchase Details
Closed on
Nov 12, 1986
Purchase Details
Closed on
Sep 5, 1986
Create a Home Valuation Report for This Property
The Home Valuation Report is an in-depth analysis detailing your home's value as well as a comparison with similar homes in the area
Home Values in the Area
Average Home Value in this Area
Purchase History
| Date | Buyer | Sale Price | Title Company |
|---|---|---|---|
| Frangool Dina | $174,000 | Title365 | |
| Young Daryl | $189,000 | Fidelity National Title Co | |
| Baugh Wesley Allen | $59,503 | Orange Coast Title Company | |
| -- | $63,600 | -- | |
| -- | $58,000 | -- | |
| -- | $68,000 | -- | |
| -- | $59,000 | -- |
Source: Public Records
Mortgage History
| Date | Status | Borrower | Loan Amount |
|---|---|---|---|
| Previous Owner | Young Daryl | $151,200 | |
| Closed | Young Daryl | $37,800 |
Source: Public Records
Tax History Compared to Growth
Tax History
| Year | Tax Paid | Tax Assessment Tax Assessment Total Assessment is a certain percentage of the fair market value that is determined by local assessors to be the total taxable value of land and additions on the property. | Land | Improvement |
|---|---|---|---|---|
| 2025 | $3,133 | $209,109 | $107,169 | $101,940 |
| 2024 | $3,133 | $205,010 | $105,068 | $99,942 |
| 2023 | $3,373 | $200,991 | $103,008 | $97,983 |
| 2022 | $2,404 | $197,051 | $100,989 | $96,062 |
| 2021 | $2,371 | $193,188 | $99,009 | $94,179 |
| 2020 | $2,346 | $191,208 | $97,994 | $93,214 |
| 2019 | $2,317 | $187,460 | $96,073 | $91,387 |
| 2018 | $2,279 | $183,786 | $94,190 | $89,596 |
| 2017 | $30 | $180,184 | $92,344 | $87,840 |
| 2016 | $2,161 | $176,652 | $90,534 | $86,118 |
| 2015 | $1,895 | $160,000 | $82,000 | $78,000 |
| 2014 | -- | $139,000 | $72,000 | $67,000 |
Source: Public Records
Map
Nearby Homes
- 730 W Chase Ave
- 1000 Estes St Unit 44
- 1000 Estes St Unit 11
- 1440 S Orange Ave Unit 64
- 1440 S Orange Ave Unit 92
- 1440 S Orange Ave Unit 27
- 1440 S Orange Ave Unit 71
- 1440 S Orange Ave Unit 99
- 1440 S Orange Ave
- 908 S Sunshine Ave Unit 18
- 1490 S Orange Ave Unit 117
- 868 Pearl Place
- 1521 Kimberly Woods Dr
- 1198 Benjamin Place
- 649 W Washington Ave
- 1288 Avocado Ave
- 1006 Avocado Ave
- 652 S Orange Ave
- 449 Avenida Abajo
- 10310 Fuerte Dr
- 1145 Emerald Ave
- 1151 Emerald Ave
- 1149 Emerald Ave
- 1137 Emerald Ave
- 1131 Emerald Ave
- 1125 Emerald Ave
- 1123 Emerald Ave Unit LU2
- 1121 Emerald Ave
- 1153 Emerald Ave Unit LU8
- 1139 Emerald Ave
- 1147 Emerald Ave
- 1143 Emerald Ave
- 1135 Emerald Ave
- 1133 Emerald Ave
- 1127 Emerald Ave
- 1159 Emerald Ave
- 1155 Emerald Ave
- 565 W Chase Ave
- 1120 Emerald Ave
- 1130 Emerald Ave