1129 Main St Acushnet, MA 02743
Acushnet AreaEstimated Value: $523,803 - $651,000
About This Home
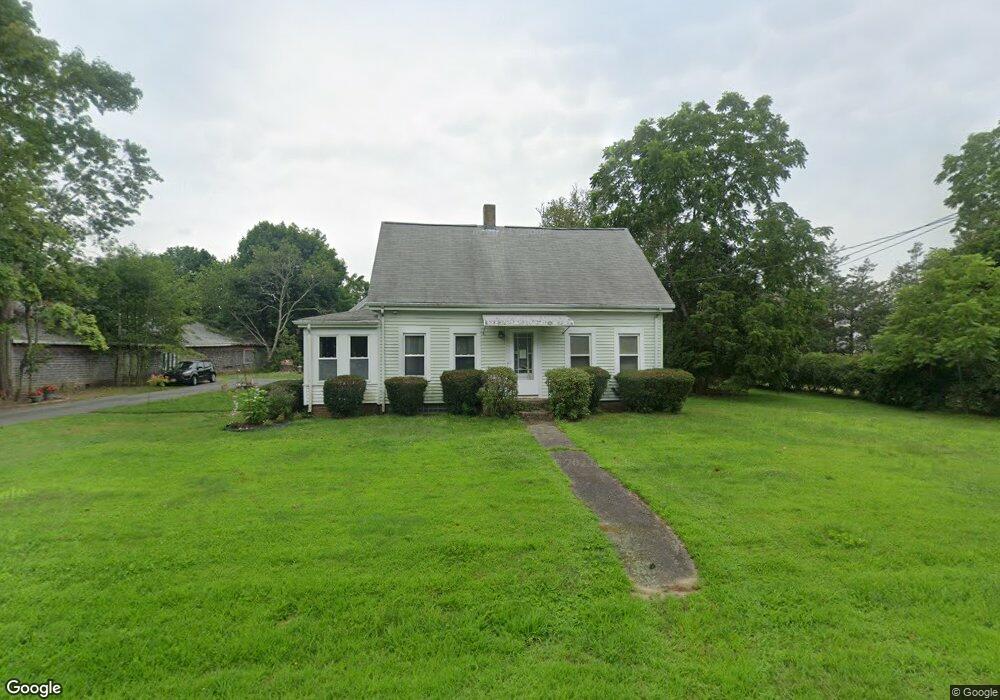
This home is located at 1129 Main St, Acushnet, MA 02743 and is currently estimated at $607,951, approximately $337 per square foot. 1129 Main St is a home located in Bristol County with nearby schools including Acushnet Elementary School, Albert F Ford Middle School, and St Francis Xavier Elementary School.
Ownership History
We collect this data history from publicly available records. To have your information removed, we recommend requesting removal directly through your county’s website.
Purchase Details
Purchase Details
Purchase History
We collect this data history from publicly available records. To have your information removed, we recommend requesting removal directly through your county’s website.
| Date | Buyer | Sale Price | Title Company |
|---|---|---|---|
| -- | -- | ||
| $117,000 | -- |
Mortgage History
We collect this data history from publicly available records. To have your information removed, we recommend requesting removal directly through your county’s website.
| Date | Status | Borrower | Loan Amount |
|---|---|---|---|
| Open | $631,500 | ||
| Closed | $95,000 | ||
| Previous Owner | $161,000 | ||
| Previous Owner | $25,000 | ||
| Previous Owner | $7,000 | ||
| Previous Owner | $106,400 |
Tax History
We collect this data history from publicly available records. To have your information removed, we recommend requesting removal directly through your county’s website.
| Year | Tax Paid | Tax Assessment Tax Assessment Total Assessment is a certain percentage of the fair market value that is determined by local assessors to be the total taxable value of land and additions on the property. | Land | Improvement |
|---|---|---|---|---|
| 2025 | $46 | $428,400 | $142,000 | $286,400 |
| 2024 | $4,638 | $406,500 | $134,600 | $271,900 |
| 2023 | $4,391 | $365,900 | $122,100 | $243,800 |
| 2022 | $4,500 | $339,100 | $114,600 | $224,500 |
| 2021 | $4,189 | $302,900 | $114,600 | $188,300 |
| 2020 | $4,119 | $295,500 | $107,200 | $188,300 |
| 2019 | $3,924 | $276,700 | $102,200 | $174,500 |
| 2018 | $3,827 | $265,400 | $102,200 | $163,200 |
| 2017 | $3,717 | $257,400 | $102,200 | $155,200 |
| 2016 | $3,563 | $245,200 | $102,200 | $143,000 |
| 2015 | $3,501 | $245,200 | $102,200 | $143,000 |
Map
- 47 Clems Way Unit 47
- 1236 Main St
- 219 Leonard St
- 921 Main St
- 0 Land Way Unit 73479153
- 955 Middle Rd
- 1324 Main St
- 0 Keene Rd Unit 73459818
- 3 Blacksmith Dr
- 104 Robinson Rd
- 0 Rounseville Rd
- 1479 Main St
- 17 David St
- 1527 Main St
- 79 Park Dr
- 6 Evergreen Dr
- 8 Morses Ln
- 28 Gammons Rd
- 375 Middle Rd
- 9 Joseph St
Ask me questions while you tour the home.