1129 Monroe Dr Unit D Boulder, CO 80303
East Aurora NeighborhoodEstimated Value: $434,000 - $467,000
2
Beds
1
Bath
1,044
Sq Ft
$436/Sq Ft
Est. Value
About This Home
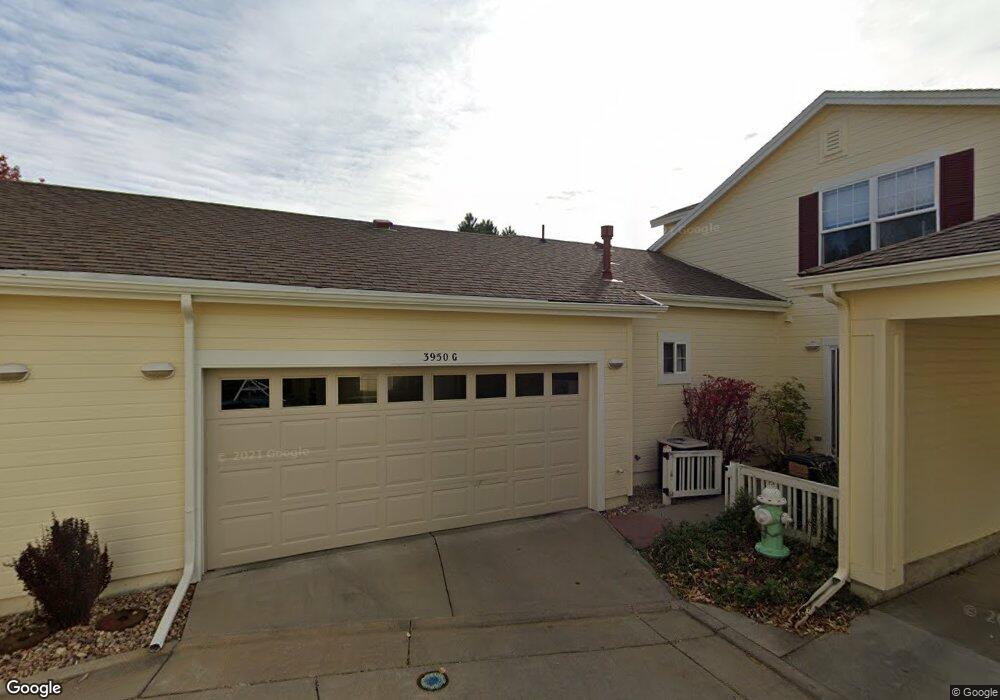
This home is located at 1129 Monroe Dr Unit D, Boulder, CO 80303 and is currently estimated at $454,798, approximately $435 per square foot. 1129 Monroe Dr Unit D is a home located in Boulder County with nearby schools including Creekside Elementary School, Manhattan Middle School of the Arts & Academics, and Fairview High School.
Ownership History
Date
Name
Owned For
Owner Type
Purchase Details
Closed on
Feb 17, 2023
Sold by
Johnson Nancy L
Bought by
Warner Dina and Warner-Rosen Reuel
Current Estimated Value
Purchase Details
Closed on
Jun 1, 1999
Sold by
Highfill John G and Highfill Michelle D
Bought by
Johnson Nancy L
Home Financials for this Owner
Home Financials are based on the most recent Mortgage that was taken out on this home.
Original Mortgage
$120,150
Interest Rate
7.02%
Purchase Details
Closed on
Sep 3, 1993
Sold by
Eby Roy Z and Eby Margaret R
Bought by
Highfill John G
Home Financials for this Owner
Home Financials are based on the most recent Mortgage that was taken out on this home.
Original Mortgage
$71,636
Interest Rate
7.23%
Mortgage Type
FHA
Purchase Details
Closed on
Dec 4, 1992
Bought by
Johnson Nancy L and Myers Scott
Purchase Details
Closed on
Aug 14, 1990
Bought by
Johnson Nancy L and Myers Scott
Create a Home Valuation Report for This Property
The Home Valuation Report is an in-depth analysis detailing your home's value as well as a comparison with similar homes in the area
Home Values in the Area
Average Home Value in this Area
Purchase History
| Date | Buyer | Sale Price | Title Company |
|---|---|---|---|
| Warner Dina | $425,000 | -- | |
| Johnson Nancy L | $133,500 | -- | |
| Highfill John G | $72,000 | -- | |
| Johnson Nancy L | -- | -- | |
| Johnson Nancy L | $46,000 | -- |
Source: Public Records
Mortgage History
| Date | Status | Borrower | Loan Amount |
|---|---|---|---|
| Previous Owner | Johnson Nancy L | $120,150 | |
| Previous Owner | Highfill John G | $71,636 |
Source: Public Records
Tax History
| Year | Tax Paid | Tax Assessment Tax Assessment Total Assessment is a certain percentage of the fair market value that is determined by local assessors to be the total taxable value of land and additions on the property. | Land | Improvement |
|---|---|---|---|---|
| 2025 | $2,623 | $31,900 | $10,825 | $21,075 |
| 2024 | $2,623 | $31,900 | $10,825 | $21,075 |
| 2023 | $2,577 | $29,842 | $14,264 | $19,263 |
| 2022 | $2,595 | $27,946 | $10,300 | $17,646 |
| 2021 | $2,475 | $28,750 | $10,596 | $18,154 |
| 2020 | $2,759 | $31,696 | $9,867 | $21,829 |
| 2019 | $2,717 | $31,696 | $9,867 | $21,829 |
| 2018 | $2,232 | $25,740 | $10,296 | $15,444 |
| 2017 | $2,162 | $28,457 | $11,383 | $17,074 |
| 2016 | $1,753 | $20,250 | $8,119 | $12,131 |
| 2015 | $1,660 | $17,019 | $6,846 | $10,173 |
| 2014 | $1,463 | $17,019 | $6,846 | $10,173 |
Source: Public Records
Map
Nearby Homes
- 1189 Monroe Dr Unit D
- 4222 Monroe Dr Unit C
- 4281 Eaton Ct
- 905 36th St
- 885 35th St
- 875 Orman Dr
- 770 36th St
- 3235 Euclid Ave
- 3161 Madison Ave Unit N302
- 3161 Madison Ave Unit 313
- 3161 Madison Ave Unit P317
- 780 33rd St
- 3009 Madison Ave Unit L216
- 3009 Madison Ave Unit 105I
- 3009 Madison Ave Unit M-315
- 790 Morgan Dr
- 3000 Colorado Ave Unit B206
- 3000 Colorado Ave Unit H231
- 4660 Talbot Dr
- 3100 Arrowwood Ln
- 1129 Monroe Dr Unit C
- 1129 Monroe Dr Unit B
- 1129 Monroe Dr Unit A
- 1129 Monroe Dr
- 1149 Monroe Dr Unit D
- 1149 Monroe Dr Unit C
- 1149 Monroe Dr Unit B
- 1149 Monroe Dr Unit A
- 1149 Monroe Dr Unit B
- 1149 Monroe Dr Unit 213
- 1139 Monroe Dr Unit D
- 1139 Monroe Dr Unit C
- 1139 Monroe Dr Unit B
- 1139 Monroe Dr Unit A
- 1139 Monroe Dr
- 3910 Colorado Ave Unit L
- 3910 Colorado Ave Unit K
- 3910 Colorado Ave Unit J
- 3910 Colorado Ave Unit I
- 3910 Colorado Ave Unit H
Your Personal Tour Guide
Ask me questions while you tour the home.