1129 N Leamington Ave Chicago, IL 60651
Austin NeighborhoodEstimated Value: $172,000 - $300,000
2
Beds
1
Bath
1,097
Sq Ft
$229/Sq Ft
Est. Value
About This Home
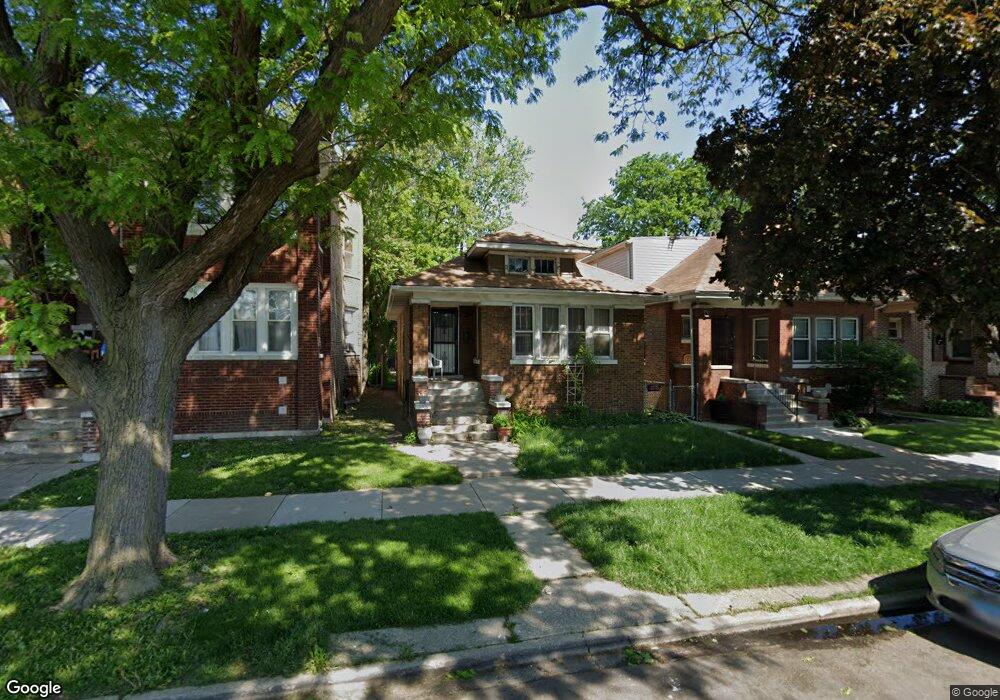
This home is located at 1129 N Leamington Ave, Chicago, IL 60651 and is currently estimated at $251,294, approximately $229 per square foot. 1129 N Leamington Ave is a home located in Cook County with nearby schools including McNair School of Excellence, Orr Academy High School, and Moving Everest Charter School.
Ownership History
Date
Name
Owned For
Owner Type
Purchase Details
Closed on
Apr 25, 2007
Sold by
Thompson Claudia and Drake Venetta C
Bought by
Thompson Claudia
Current Estimated Value
Home Financials for this Owner
Home Financials are based on the most recent Mortgage that was taken out on this home.
Original Mortgage
$85,000
Outstanding Balance
$51,534
Interest Rate
6.2%
Mortgage Type
New Conventional
Estimated Equity
$199,760
Purchase Details
Closed on
Oct 1, 1999
Sold by
George Wilson
Bought by
Thompson Claudia and Drake Vanetia C
Home Financials for this Owner
Home Financials are based on the most recent Mortgage that was taken out on this home.
Original Mortgage
$77,761
Interest Rate
7.91%
Mortgage Type
FHA
Purchase Details
Closed on
Jun 11, 1996
Sold by
Bankers Trust Company Of California Na
Bought by
George Wilson
Home Financials for this Owner
Home Financials are based on the most recent Mortgage that was taken out on this home.
Original Mortgage
$62,787
Interest Rate
8.07%
Create a Home Valuation Report for This Property
The Home Valuation Report is an in-depth analysis detailing your home's value as well as a comparison with similar homes in the area
Home Values in the Area
Average Home Value in this Area
Purchase History
| Date | Buyer | Sale Price | Title Company |
|---|---|---|---|
| Thompson Claudia | -- | Lawyers | |
| Thompson Claudia | $78,000 | Professional National Title | |
| George Wilson | $46,000 | -- |
Source: Public Records
Mortgage History
| Date | Status | Borrower | Loan Amount |
|---|---|---|---|
| Open | Thompson Claudia | $85,000 | |
| Closed | Thompson Claudia | $77,761 | |
| Previous Owner | George Wilson | $62,787 |
Source: Public Records
Tax History Compared to Growth
Tax History
| Year | Tax Paid | Tax Assessment Tax Assessment Total Assessment is a certain percentage of the fair market value that is determined by local assessors to be the total taxable value of land and additions on the property. | Land | Improvement |
|---|---|---|---|---|
| 2024 | $2,676 | $16,000 | $4,536 | $11,464 |
| 2023 | $2,587 | $16,000 | $3,591 | $12,409 |
| 2022 | $2,587 | $16,000 | $3,591 | $12,409 |
| 2021 | $2,548 | $16,000 | $3,591 | $12,409 |
| 2020 | $1,788 | $11,129 | $3,213 | $7,916 |
| 2019 | $1,795 | $12,366 | $3,213 | $9,153 |
| 2018 | $1,764 | $12,366 | $3,213 | $9,153 |
| 2017 | $1,796 | $11,716 | $2,835 | $8,881 |
| 2016 | $1,846 | $11,716 | $2,835 | $8,881 |
| 2015 | $1,666 | $11,716 | $2,835 | $8,881 |
| 2014 | $1,535 | $10,844 | $2,646 | $8,198 |
| 2013 | $1,972 | $10,844 | $2,646 | $8,198 |
Source: Public Records
Map
Nearby Homes
- 1107 N Leamington Ave
- 1024 N Lawler Ave
- 1028 N Lavergne Ave
- 1000 N Leamington Ave
- 4946 W Division St
- 5226 W Crystal St
- 940 N Leclaire Ave
- 4952 W Augusta Blvd
- 949 N Lawler Ave
- 4920 W Cortez St
- 5244 W Crystal St
- 944 N Lavergne Ave
- 1059 N Lorel Ave
- 1256 N Lockwood Ave
- 4924 W Walton St
- 1351 N Latrobe Ave
- 4830 W Crystal St
- 4957 W Iowa St
- 4907 W Walton St
- 844 N Laramie Ave
- 1127 N Leamington Ave
- 1131 N Leamington Ave
- 1123 N Leamington Ave
- 1135 N Leamington Ave Unit 2
- 1137 N Leamington Ave
- 1121 N Leamington Ave
- 1141 N Leamington Ave
- 1117 N Leamington Ave
- 1124 N Leclaire Ave
- 1124 N Leclaire Ave
- 1132 N Leclaire Ave
- 1145 N Leamington Ave
- 1115 N Leamington Ave
- 1134 N Leclaire Ave
- 1128 N Leclaire Ave
- 1128 N Leclaire Ave
- 1122 N Leclaire Ave Unit 1
- 1122 N Leclaire Ave
- 1136 N Leclaire Ave
- 1120 N Leclaire Ave