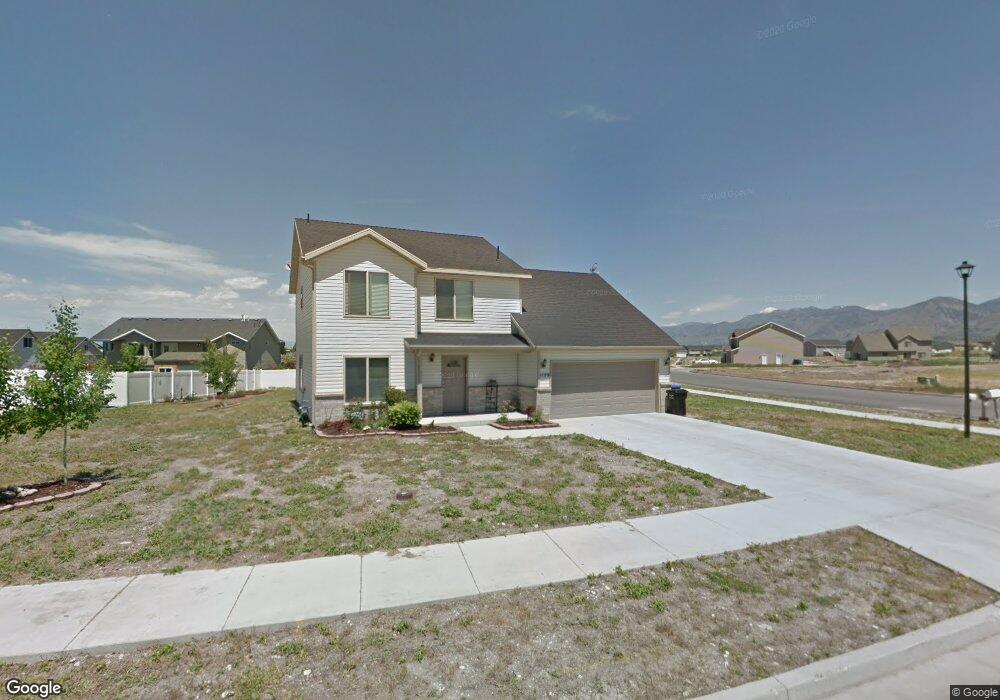
1129 W 2550 S Unit 89 Nibley, UT 84321
Estimated Value: $487,944 - $552,000
--
Bed
--
Bath
2,025
Sq Ft
$257/Sq Ft
Est. Value
About This Home
This home is located at 1129 W 2550 S Unit 89, Nibley, UT 84321 and is currently estimated at $519,736, approximately $256 per square foot. 1129 W 2550 S Unit 89 is a home located in Cache County with nearby schools including Nibley School, Spring Creek Middle School, and South Cache Middle School.
Ownership History
Date
Name
Owned For
Owner Type
Purchase Details
Closed on
Jul 22, 2025
Sold by
Strickland Beverly
Bought by
Strickland Beverly and Nielson Dixon Y
Current Estimated Value
Purchase Details
Closed on
Aug 28, 2009
Sold by
Sierra Homes Construction Inc
Bought by
Strickland Beverly
Home Financials for this Owner
Home Financials are based on the most recent Mortgage that was taken out on this home.
Original Mortgage
$193,750
Interest Rate
5.09%
Mortgage Type
New Conventional
Purchase Details
Closed on
May 1, 2009
Sold by
Horizon Enterprises Inc
Bought by
Sierra Homes Construction Inc
Home Financials for this Owner
Home Financials are based on the most recent Mortgage that was taken out on this home.
Original Mortgage
$130,200
Interest Rate
4.71%
Mortgage Type
Construction
Create a Home Valuation Report for This Property
The Home Valuation Report is an in-depth analysis detailing your home's value as well as a comparison with similar homes in the area
Home Values in the Area
Average Home Value in this Area
Purchase History
| Date | Buyer | Sale Price | Title Company |
|---|---|---|---|
| Strickland Beverly | -- | Title Insurance Agency | |
| Strickland Beverly | -- | Title Insurance Agency | |
| Strickland Beverly | -- | American Secure Title | |
| Sierra Homes Construction Inc | -- | Cache Title Company |
Source: Public Records
Mortgage History
| Date | Status | Borrower | Loan Amount |
|---|---|---|---|
| Previous Owner | Strickland Beverly | $193,750 | |
| Previous Owner | Sierra Homes Construction Inc | $130,200 | |
| Previous Owner | Sierra Homes Construction Inc | $123,900 |
Source: Public Records
Tax History Compared to Growth
Tax History
| Year | Tax Paid | Tax Assessment Tax Assessment Total Assessment is a certain percentage of the fair market value that is determined by local assessors to be the total taxable value of land and additions on the property. | Land | Improvement |
|---|---|---|---|---|
| 2025 | $21 | $274,390 | $0 | $0 |
| 2024 | $2,210 | $275,030 | $0 | $0 |
| 2023 | $2,298 | $267,850 | $0 | $0 |
| 2022 | $2,392 | $267,850 | $0 | $0 |
| 2021 | $1,629 | $283,301 | $68,000 | $215,301 |
| 2020 | $1,542 | $255,219 | $68,000 | $187,219 |
| 2019 | $1,617 | $255,219 | $68,000 | $187,219 |
| 2018 | $1,410 | $217,160 | $50,000 | $167,160 |
| 2017 | $1,411 | $115,060 | $0 | $0 |
| 2016 | $1,426 | $96,450 | $0 | $0 |
| 2015 | $1,154 | $93,700 | $0 | $0 |
| 2014 | $1,128 | $93,700 | $0 | $0 |
| 2013 | -- | $99,200 | $0 | $0 |
Source: Public Records
Map
Nearby Homes
- 2485 S 1296 W
- 1045 W 2400 S
- 1254 W 2401 S
- 2616 S 900 W
- 2301 S 1050 W
- 2301 S 1050 W Unit 99
- 2313 S 1000 W Unit 110
- 2313 S 1000 W
- 1140 2260 S
- 2814 S 1150 W
- 2271 S 1050 W
- 2271 S 1050 W Unit 96
- 2237 S 1150 W Unit 39
- 2206 S 1120 W Unit 65
- 2206 S 1120 W
- Alpine Plan at Firefly Estates - Single Family
- Monroe Plan at Firefly Estates - Single Family
- Gala Plan at Firefly Estates - Single Family
- Phoenix Plan at Firefly Estates - Single Family
- Briarwood Plan at Firefly Estates - Single Family
- 1143 W 2550 S Unit 90
- 1143 W 2550 S
- 1126 W 2500 S
- 1140 W 2500 S
- 1140 W 2500 S Unit 87
- 2565 S 1100 W
- 1136 W 2550 S
- 1136 W 2550 S Unit 96
- 1159 W 2550 S Unit 91
- 1159 W 2550 S
- 2530 S 1100 W
- 1154 W 2500 S
- 1154 W 2500 S Unit 86
- 2560 S 1100 W
- 1152 W 2550 S
- 1152 W 2550 S Unit 95
- 1080 W 2500 S
- 1133 W 2600 S Unit 99
- 1133 W 2600 S
- 1115 W 2600 S Unit 98