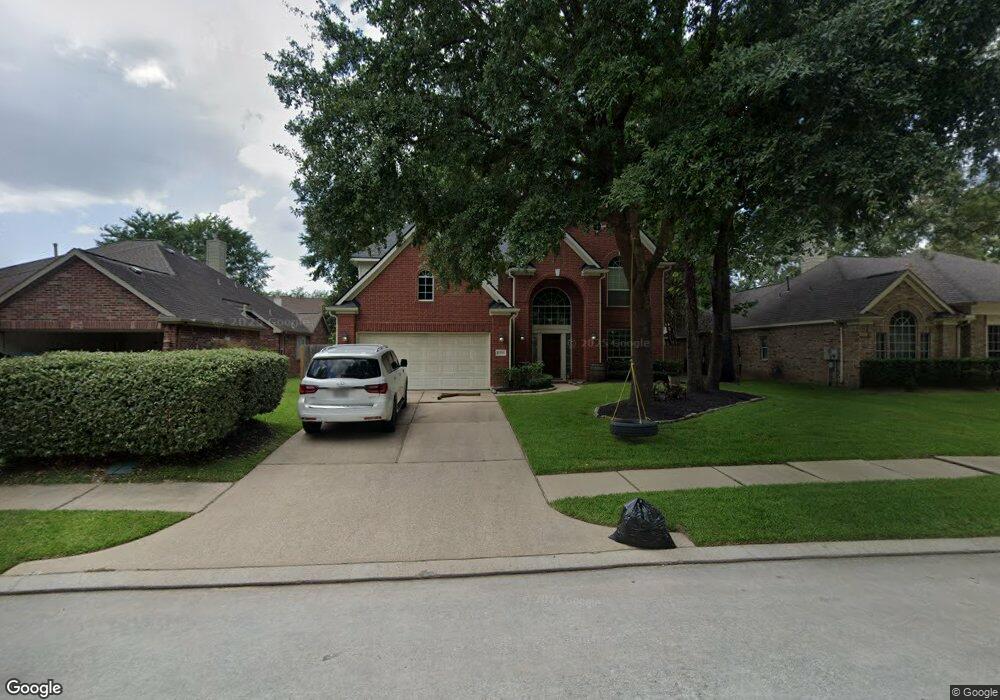
11293 Suncrest Estates Ct Conroe, TX 77385
Imperial Oaks NeighborhoodEstimated Value: $352,241 - $384,000
4
Beds
3
Baths
2,417
Sq Ft
$154/Sq Ft
Est. Value
About This Home
This home is located at 11293 Suncrest Estates Ct, Conroe, TX 77385 and is currently estimated at $371,560, approximately $153 per square foot. 11293 Suncrest Estates Ct is a home located in Montgomery County with nearby schools including Kaufman Elementary School, Vogel Intermediate School, and Irons J High School.
Ownership History
Date
Name
Owned For
Owner Type
Purchase Details
Closed on
Apr 22, 2015
Sold by
Walters Terry
Bought by
Scharf Alan K
Current Estimated Value
Home Financials for this Owner
Home Financials are based on the most recent Mortgage that was taken out on this home.
Original Mortgage
$234,671
Outstanding Balance
$180,720
Interest Rate
3.75%
Mortgage Type
FHA
Estimated Equity
$190,840
Purchase Details
Closed on
Apr 8, 2003
Sold by
Kimball Hill Homes Texas Inc
Bought by
Walters Terry
Home Financials for this Owner
Home Financials are based on the most recent Mortgage that was taken out on this home.
Original Mortgage
$122,000
Interest Rate
5.71%
Purchase Details
Closed on
Sep 10, 1999
Sold by
Imperial Oaks Joint Venture
Bought by
Scharf Alan K
Create a Home Valuation Report for This Property
The Home Valuation Report is an in-depth analysis detailing your home's value as well as a comparison with similar homes in the area
Home Values in the Area
Average Home Value in this Area
Purchase History
| Date | Buyer | Sale Price | Title Company |
|---|---|---|---|
| Scharf Alan K | -- | Texas American Title Co | |
| Walters Terry | -- | First Southwestern Title Co | |
| Scharf Alan K | -- | -- |
Source: Public Records
Mortgage History
| Date | Status | Borrower | Loan Amount |
|---|---|---|---|
| Open | Scharf Alan K | $234,671 | |
| Previous Owner | Walters Terry | $122,000 |
Source: Public Records
Tax History Compared to Growth
Tax History
| Year | Tax Paid | Tax Assessment Tax Assessment Total Assessment is a certain percentage of the fair market value that is determined by local assessors to be the total taxable value of land and additions on the property. | Land | Improvement |
|---|---|---|---|---|
| 2025 | $5,962 | $343,797 | $68,000 | $275,797 |
| 2024 | $7,350 | $356,492 | $68,000 | $288,492 |
| 2023 | $7,350 | $349,570 | $68,000 | $281,570 |
| 2022 | $7,081 | $307,070 | $25,500 | $281,570 |
| 2021 | $6,126 | $246,750 | $25,500 | $221,250 |
| 2020 | $6,086 | $235,490 | $25,500 | $209,990 |
| 2019 | $5,971 | $236,550 | $25,500 | $211,050 |
| 2018 | $5,969 | $224,020 | $25,500 | $198,520 |
| 2017 | $6,075 | $224,020 | $25,500 | $198,520 |
| 2016 | $6,075 | $224,020 | $25,500 | $198,520 |
| 2015 | $4,614 | $193,130 | $25,500 | $174,490 |
| 2014 | $4,614 | $175,570 | $25,500 | $154,240 |
Source: Public Records
Map
Nearby Homes
- 22941 Antiqua Estates Ct
- 2103 Winding Hollow Ct
- 2143 Westover Park Cir
- 32319 Archer Park
- 1427 Redwood Village Cir
- 2047 Copperwood Park Ln
- 1423 W Welsford Dr
- 32331 Summer Park Ln
- 2526 Hidden Park Ln
- 1627 Sterling Village Dr
- 32315 Golden Oak Park Ln
- 2614 Winding Creek Way
- 2611 Winding Creek Way
- 31235 Windcrest Park Ln
- 11291 Darby Loop
- 31002 Deerwood Park Ln
- 31214 Windcrest Park Ln
- 2623 Cedar Path Ln
- 31115 Perlican Dr
- 31311 N Head Dr
- 11289 Suncrest Estates Ct
- 11297 Suncrest Estates Ct
- 23934 Dorrington Estates Ln
- 23928 Dorrington Estates Ln
- 23938 Dorrington Estates Ln
- 11285 Suncrest Estates Ct
- 11276 Suncrest Estates Ct
- 22986 Woodside Estates Ln
- 23922 Dorrington Estates Ln
- 11272 Suncrest Estates Ct
- 22981 Woodside Estates Ln
- 23916 Dorrington Estates Ln
- 22990 Woodside Estates Ln
- 11281 Suncrest Estates Ct
- 23946 Dorrington Estates Ln
- 22989 Woodside Estates Ln
- 11277 Suncrest Estates Ct
- 11268 Suncrest Estates Ct
- 23912 Dorrington Estates Ln
- 23929 Dorrington Estates Ln