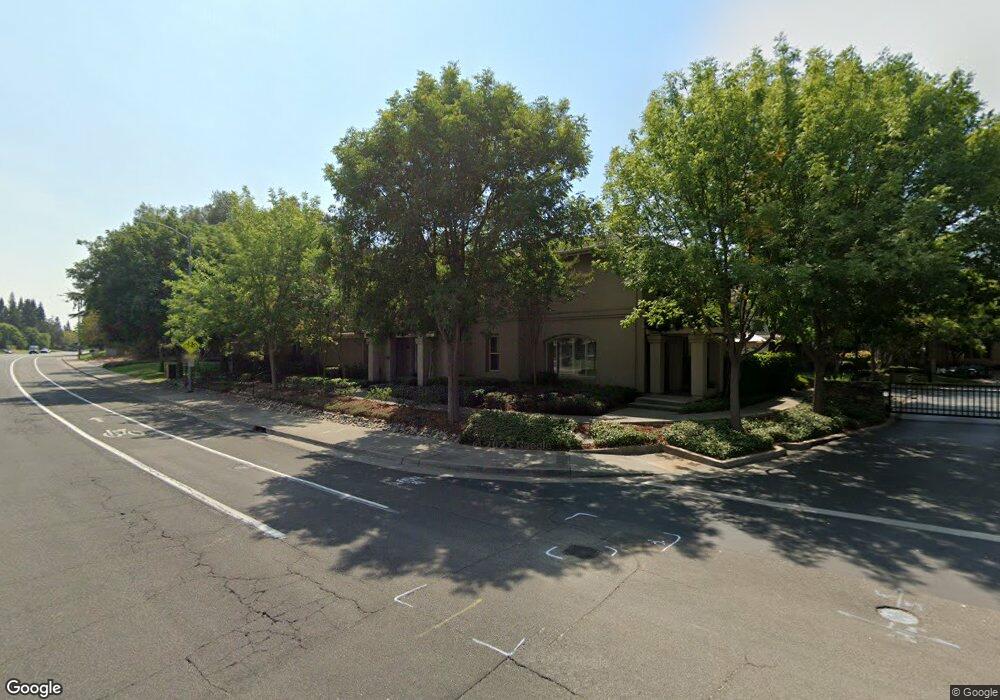
11296 Stanford Court Ln Unit L Gold River, CA 95670
Estimated Value: $431,000 - $594,000
2
Beds
3
Baths
1,892
Sq Ft
$267/Sq Ft
Est. Value
About This Home
This home is located at 11296 Stanford Court Ln Unit L, Gold River, CA 95670 and is currently estimated at $504,496, approximately $266 per square foot. 11296 Stanford Court Ln Unit L is a home located in Sacramento County with nearby schools including Gold River Discovery Center and Rio Americano High School.
Ownership History
Date
Name
Owned For
Owner Type
Purchase Details
Closed on
Oct 8, 2019
Sold by
Ewert Colleen
Bought by
Smith Sterling
Current Estimated Value
Home Financials for this Owner
Home Financials are based on the most recent Mortgage that was taken out on this home.
Original Mortgage
$175,000
Outstanding Balance
$153,309
Interest Rate
3.5%
Mortgage Type
New Conventional
Estimated Equity
$351,187
Purchase Details
Closed on
Oct 29, 2018
Sold by
Shears George C and Shears Laura E
Bought by
Ewert Colleen
Home Financials for this Owner
Home Financials are based on the most recent Mortgage that was taken out on this home.
Original Mortgage
$315,200
Interest Rate
4.6%
Mortgage Type
New Conventional
Purchase Details
Closed on
Oct 26, 2017
Sold by
Shears George C and Shears Laura E
Bought by
Shears George C and Shears Laura E
Create a Home Valuation Report for This Property
The Home Valuation Report is an in-depth analysis detailing your home's value as well as a comparison with similar homes in the area
Home Values in the Area
Average Home Value in this Area
Purchase History
| Date | Buyer | Sale Price | Title Company |
|---|---|---|---|
| Smith Sterling | $425,000 | Orange Coast Ttl Co Of Nocal | |
| Ewert Colleen | $394,000 | North American Title Company | |
| Shears George C | -- | None Available |
Source: Public Records
Mortgage History
| Date | Status | Borrower | Loan Amount |
|---|---|---|---|
| Open | Smith Sterling | $175,000 | |
| Previous Owner | Ewert Colleen | $315,200 |
Source: Public Records
Tax History Compared to Growth
Tax History
| Year | Tax Paid | Tax Assessment Tax Assessment Total Assessment is a certain percentage of the fair market value that is determined by local assessors to be the total taxable value of land and additions on the property. | Land | Improvement |
|---|---|---|---|---|
| 2025 | $5,524 | $464,795 | $82,021 | $382,774 |
| 2024 | $5,524 | $455,682 | $80,413 | $375,269 |
| 2023 | $5,382 | $446,748 | $78,837 | $367,911 |
| 2022 | $5,350 | $437,990 | $77,292 | $360,698 |
| 2021 | $5,259 | $429,403 | $75,777 | $353,626 |
| 2020 | $5,160 | $425,000 | $75,000 | $350,000 |
| 2019 | $4,782 | $394,000 | $60,000 | $334,000 |
| 2018 | $4,850 | $396,700 | $84,190 | $312,510 |
| 2017 | $4,324 | $350,000 | $30,000 | $320,000 |
| 2016 | $4,437 | $381,298 | $80,922 | $300,376 |
| 2015 | $4,200 | $361,799 | $76,167 | $285,632 |
| 2014 | $3,956 | $341,320 | $71,856 | $269,464 |
Source: Public Records
Map
Nearby Homes
- 2133 Gold Rush Dr
- 11469 Tunnel Hill Way
- 11267 Crocker Grove Ln
- 2074 Gray Eagle Ct
- 11457 Huntington Village Ln Unit 18
- 11416 Treasure Hill Ct
- 2206 Promontory Point Ln
- 11285 Gold Country Blvd
- 2002 Discovery Village Ln
- 2139 Dame Shirley Way
- 11303 Gold Country Blvd
- 1833 Discovery Village Ln
- 11218 Platte River Ct
- 11305 Sutters Mill Cir
- 2337 Pargo Place
- 11447 Gold Station Dr
- 11360 Gold Country Blvd
- 11568 Pyrites Ct
- 1911 Discovery Village Ln
- 11600 Gold Country Blvd
- 11296 Stanford Court Ln Unit 110
- 11296 Stanford Court Ln Unit 107
- 11296 Stanford Court Ln Unit 101
- 11296 Stanford Court Ln Unit 103
- 11296 Stanford Court Ln Unit 106
- 11296 Stanford Court Ln Unit 102
- 11296 Stanford Court Ln Unit 104
- 11296 Stanford Court Ln Unit 109
- 11296 Stanford Court Ln Unit L
- 11296 Stanford Court Ln Unit L
- 11296 Stanford Court Ln Unit L
- 11296 Stanford Court Ln Unit L
- 11296 Stanford Court Ln Unit L
- 11296 Stanford Court Ln Unit L
- 11296 Stanford Court Ln Unit L
- 11296 Stanford Court Ln Unit L
- 11296 Stanford Court Ln Unit L
- 11290 Stanford Court Ln Unit 209
- 11290 Stanford Court Ln Unit L204
- 11290 Stanford Court Ln Unit L205