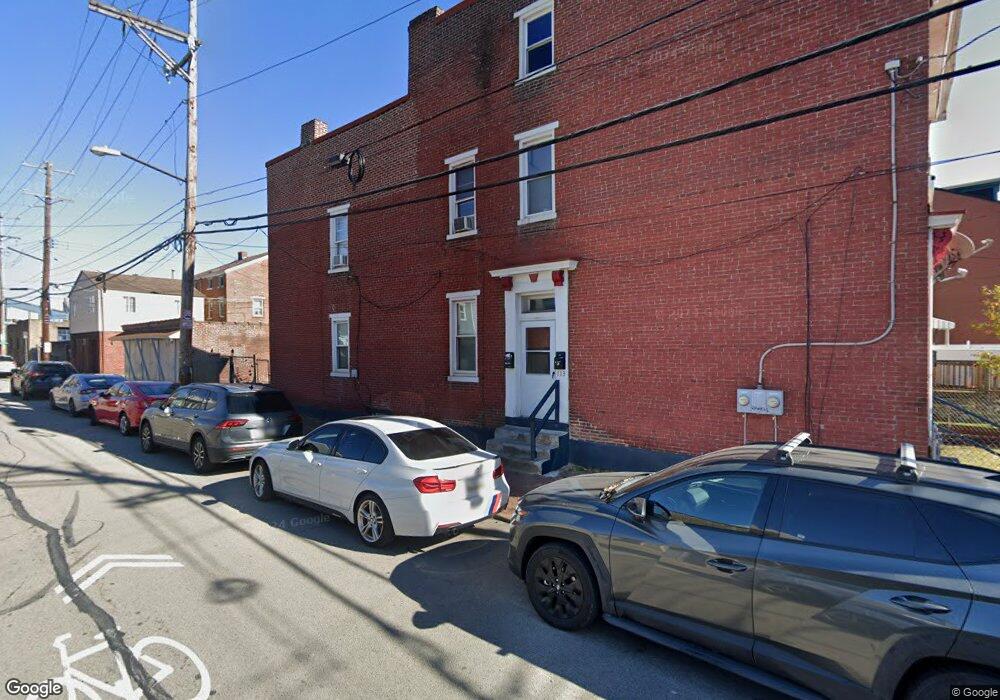
113 43rd St Pittsburgh, PA 15201
Central Lawrenceville NeighborhoodEstimated Value: $228,032 - $261,000
1
Bed
2
Baths
720
Sq Ft
$335/Sq Ft
Est. Value
About This Home
This home is located at 113 43rd St, Pittsburgh, PA 15201 and is currently estimated at $241,008, approximately $334 per square foot. 113 43rd St is a home located in Allegheny County with nearby schools including Pittsburgh Arsenal 6-8, Pittsburgh Arsenal K-5, and Pittsburgh Milliones 6-12.
Ownership History
Date
Name
Owned For
Owner Type
Purchase Details
Closed on
May 29, 2012
Sold by
Onega John M
Bought by
Jackson Keith
Current Estimated Value
Purchase Details
Closed on
Dec 24, 2007
Sold by
Red Door Realty
Bought by
Onega John M
Home Financials for this Owner
Home Financials are based on the most recent Mortgage that was taken out on this home.
Original Mortgage
$85,325
Interest Rate
6.27%
Mortgage Type
FHA
Create a Home Valuation Report for This Property
The Home Valuation Report is an in-depth analysis detailing your home's value as well as a comparison with similar homes in the area
Home Values in the Area
Average Home Value in this Area
Purchase History
| Date | Buyer | Sale Price | Title Company |
|---|---|---|---|
| Jackson Keith | $100,000 | -- | |
| Onega John M | $86,000 | -- |
Source: Public Records
Mortgage History
| Date | Status | Borrower | Loan Amount |
|---|---|---|---|
| Previous Owner | Onega John M | $85,325 |
Source: Public Records
Tax History Compared to Growth
Tax History
| Year | Tax Paid | Tax Assessment Tax Assessment Total Assessment is a certain percentage of the fair market value that is determined by local assessors to be the total taxable value of land and additions on the property. | Land | Improvement |
|---|---|---|---|---|
| 2025 | $2,304 | $100,000 | $24,000 | $76,000 |
| 2024 | $2,304 | $100,000 | $24,000 | $76,000 |
| 2023 | $2,304 | $100,000 | $24,000 | $76,000 |
| 2022 | $2,274 | $100,000 | $24,000 | $76,000 |
| 2021 | $2,299 | $100,000 | $24,000 | $76,000 |
| 2020 | $2,263 | $100,000 | $24,000 | $76,000 |
| 2019 | $2,263 | $100,000 | $24,000 | $76,000 |
| 2018 | $1,815 | $100,000 | $24,000 | $76,000 |
| 2017 | $2,263 | $100,000 | $24,000 | $76,000 |
| 2016 | $473 | $100,000 | $24,000 | $76,000 |
| 2015 | $473 | $100,000 | $24,000 | $76,000 |
| 2014 | $2,213 | $100,000 | $24,000 | $76,000 |
Source: Public Records
Map
Nearby Homes