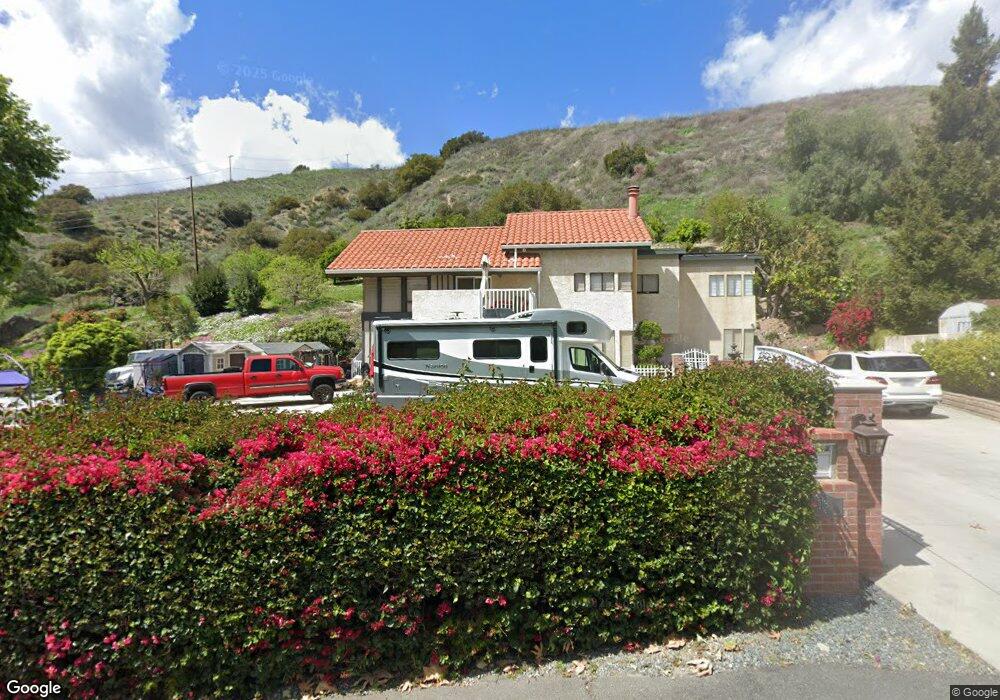
113 4th St Fillmore, CA 93015
Estimated Value: $760,000 - $826,000
4
Beds
3
Baths
2,367
Sq Ft
$341/Sq Ft
Est. Value
About This Home
This home is located at 113 4th St, Fillmore, CA 93015 and is currently estimated at $807,251, approximately $341 per square foot. 113 4th St is a home located in Ventura County with nearby schools including San Cayetano Elementary School and Fillmore Senior High.
Ownership History
Date
Name
Owned For
Owner Type
Purchase Details
Closed on
Oct 16, 2020
Sold by
Cardenas Francisco and Cardenas Francisca Cornejo
Bought by
Cardenas Francisco and Cardenas Francisca Cornejo
Current Estimated Value
Home Financials for this Owner
Home Financials are based on the most recent Mortgage that was taken out on this home.
Original Mortgage
$410,000
Interest Rate
2.8%
Mortgage Type
New Conventional
Purchase Details
Closed on
Nov 12, 2009
Sold by
Cardenas Francisco and Cardenas Francisca Cornejo
Bought by
Cardenas Francisco and Cardenas Francisca Cornejo
Create a Home Valuation Report for This Property
The Home Valuation Report is an in-depth analysis detailing your home's value as well as a comparison with similar homes in the area
Home Values in the Area
Average Home Value in this Area
Purchase History
| Date | Buyer | Sale Price | Title Company |
|---|---|---|---|
| Cardenas Francisco | -- | Fidelity National Title Co | |
| Cardenas Francisco | -- | Fidelity National Title Co | |
| Cardenas Francisco | -- | None Available |
Source: Public Records
Mortgage History
| Date | Status | Borrower | Loan Amount |
|---|---|---|---|
| Closed | Cardenas Francisco | $410,000 |
Source: Public Records
Tax History
| Year | Tax Paid | Tax Assessment Tax Assessment Total Assessment is a certain percentage of the fair market value that is determined by local assessors to be the total taxable value of land and additions on the property. | Land | Improvement |
|---|---|---|---|---|
| 2025 | $4,058 | $371,488 | $136,640 | $234,848 |
| 2024 | $4,058 | $364,204 | $133,960 | $230,244 |
| 2023 | $4,001 | $357,063 | $131,333 | $225,730 |
| 2022 | $3,698 | $350,062 | $128,758 | $221,304 |
| 2021 | $4,204 | $343,199 | $126,234 | $216,965 |
| 2020 | $3,899 | $339,683 | $124,941 | $214,742 |
| 2019 | $3,909 | $333,024 | $122,492 | $210,532 |
| 2018 | $3,830 | $326,495 | $120,091 | $206,404 |
| 2017 | $3,850 | $320,094 | $117,737 | $202,357 |
| 2016 | $3,564 | $313,819 | $115,429 | $198,390 |
| 2015 | $3,464 | $309,108 | $113,697 | $195,411 |
| 2014 | $3,460 | $303,055 | $111,471 | $191,584 |
Source: Public Records
Map
Nearby Homes
- 616 Island View St
- 345 Blaine Ave
- 639 Mountain View St
- 1000 Foothill Dr
- 318 Bard St
- 444 Mountain View St
- 809 Woodgrove Rd
- 815 Woodgrove Rd
- 404 Central Ave
- 340 Central Ave
- 158 Arborwood St
- 252 Driftwood St
- 199 Rosewood St
- 915 E Telegraph Rd
- 831 Blaine Ave
- 250 E Telegraph Rd Unit 200
- 250 E Telegraph Rd Unit 68
- 250 E Telegraph Rd Unit 213
- 250 E Telegraph Rd Unit 248
- 250 E Telegraph Rd Unit 224
Your Personal Tour Guide
Ask me questions while you tour the home.