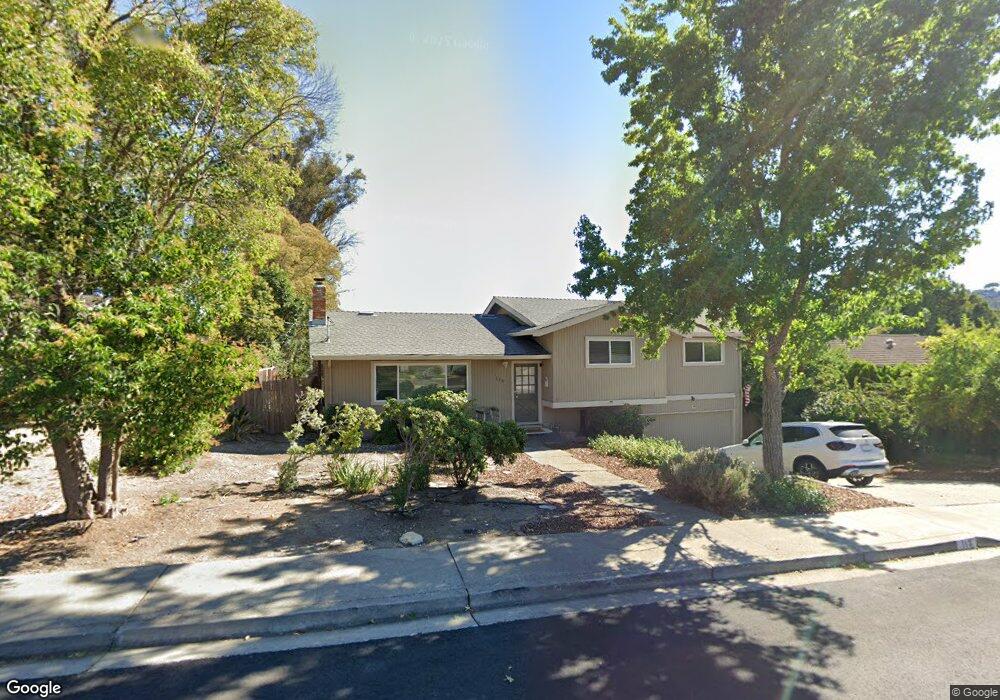
113 Allen Way Pleasant Hill, CA 94523
Estimated Value: $1,021,336 - $1,187,000
3
Beds
2
Baths
1,491
Sq Ft
$749/Sq Ft
Est. Value
About This Home
This home is located at 113 Allen Way, Pleasant Hill, CA 94523 and is currently estimated at $1,116,334, approximately $748 per square foot. 113 Allen Way is a home located in Contra Costa County with nearby schools including Strandwood Elementary School, Pleasant Hill Middle School, and College Park High School.
Ownership History
Date
Name
Owned For
Owner Type
Purchase Details
Closed on
Nov 7, 2015
Sold by
Berens Mark
Bought by
Nelson Robert Scott
Current Estimated Value
Purchase Details
Closed on
Apr 2, 2013
Sold by
Nelson Niel
Bought by
Berens Mark
Purchase Details
Closed on
May 27, 1994
Sold by
Patterson Robert M and Patterson Elizabeth P
Bought by
Nelson Neil and Nelson Nancy Melinda
Home Financials for this Owner
Home Financials are based on the most recent Mortgage that was taken out on this home.
Original Mortgage
$130,000
Interest Rate
8.35%
Mortgage Type
Purchase Money Mortgage
Create a Home Valuation Report for This Property
The Home Valuation Report is an in-depth analysis detailing your home's value as well as a comparison with similar homes in the area
Home Values in the Area
Average Home Value in this Area
Purchase History
| Date | Buyer | Sale Price | Title Company |
|---|---|---|---|
| Nelson Robert Scott | -- | None Available | |
| Berens Mark | -- | None Available | |
| Nelson Neil | $255,000 | Placer Title Company |
Source: Public Records
Mortgage History
| Date | Status | Borrower | Loan Amount |
|---|---|---|---|
| Previous Owner | Nelson Neil | $130,000 |
Source: Public Records
Tax History Compared to Growth
Tax History
| Year | Tax Paid | Tax Assessment Tax Assessment Total Assessment is a certain percentage of the fair market value that is determined by local assessors to be the total taxable value of land and additions on the property. | Land | Improvement |
|---|---|---|---|---|
| 2025 | $5,635 | $433,388 | $217,967 | $215,421 |
| 2024 | $5,538 | $424,892 | $213,694 | $211,198 |
| 2023 | $5,538 | $416,561 | $209,504 | $207,057 |
| 2022 | $5,492 | $408,395 | $205,397 | $202,998 |
| 2021 | $5,371 | $400,388 | $201,370 | $199,018 |
| 2019 | $5,244 | $388,515 | $195,399 | $193,116 |
| 2018 | $5,061 | $380,898 | $191,568 | $189,330 |
| 2017 | $4,904 | $373,430 | $187,812 | $185,618 |
| 2016 | $4,783 | $366,109 | $184,130 | $181,979 |
| 2015 | $4,739 | $360,611 | $181,365 | $179,246 |
| 2014 | $4,673 | $353,548 | $177,813 | $175,735 |
Source: Public Records
Map
Nearby Homes
- 25 Brandon Rd
- 2422 Pleasant Hill Rd Unit 6
- 589 Maureen Ln
- 309 Sunset Rd
- 808 Grayson Rd
- 312 Soule Ave
- 2049 Elinora Dr
- 1919 Helen Rd Unit 2
- 500 Creekside Rd
- 404 Beatrice Rd Unit 3
- 576 Best Rd
- 29 Richie Dr
- 5 Harwich Walk Unit 55
- 190 Cleaveland Rd Unit 12
- 277 Gloria Dr
- 170 Cleaveland Rd
- 53 Monte Cresta Ave
- 256 Douglas Ln
- 1933 Oak Park Blvd
- 105 Laurel Oak Dr