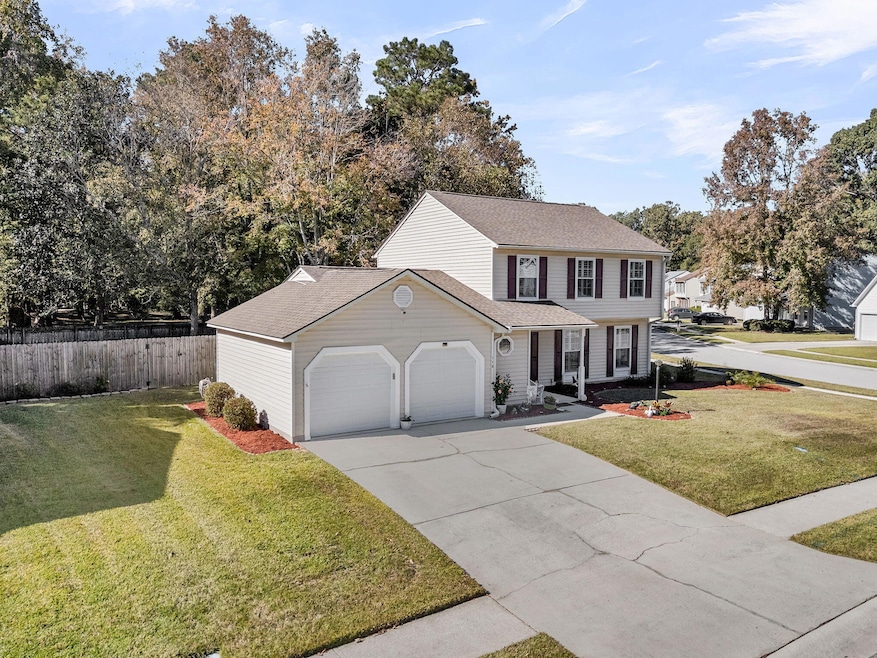
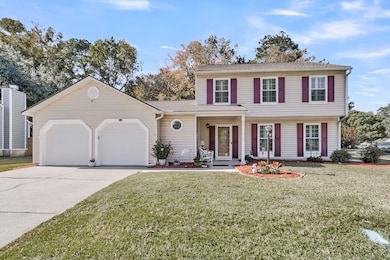
113 Berringer Dr Goose Creek, SC 29445
Estimated payment $2,080/month
Highlights
- Golf Course Community
- Clubhouse
- Traditional Architecture
- Fitness Center
- Wooded Lot
- Separate Formal Living Room
About This Home
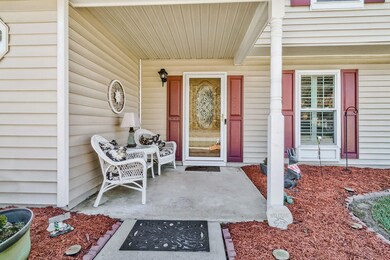
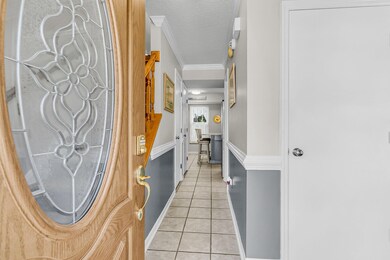
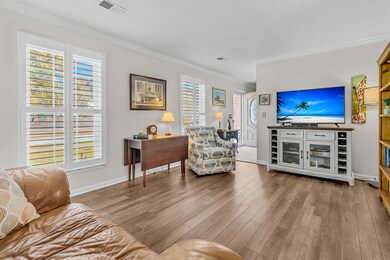
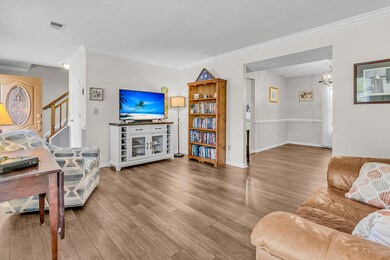
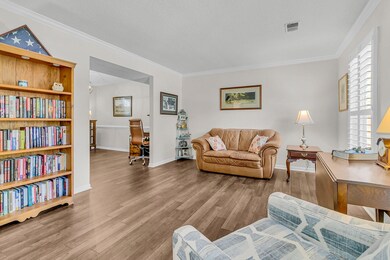
Beautifully landscaped & perfectly positioned on a corner lot, this Crowfield Plantation home backs up to a peaceful community space with a walking path--so you'll enjoy ultimate privacy with no neighbors behind! Relax on the spacious back patio or in the enclosed sunroom, all while surrounded by nature. Inside, you'll find an inviting floor plan with all formals, a big eat-in kitchen, & a cozy family room complete w/ gas fireplace. The kitchen features granite countertops, stainless steel appliances (refrigerator included), & upgraded cabinet hardware. Each bedroom offers generous floor space & ample storage. Recent updates include a roof replaced in 2021, Trane HVAC replaced in 2025, garage doors & windows replaced, new countertops, sinks, & vanities in all three bathrooms,and a beautiful walk-in shower in the primary bath. Other features include ceramic tile flooring in the foyer, hall, & kitchen, a large two-car garage w/ workshop area, privacy fence, & walking path just behind the property. Crowfield Plantation offers wonderful amenities, mature trees, & a true sense of communitymaking this the perfect place to call home!
Home Details
Home Type
- Single Family
Est. Annual Taxes
- $1,039
Year Built
- Built in 1988
Lot Details
- 0.26 Acre Lot
- Elevated Lot
- Privacy Fence
- Wood Fence
- Level Lot
- Wooded Lot
HOA Fees
- $44 Monthly HOA Fees
Parking
- 2 Car Attached Garage
- Garage Door Opener
Home Design
- Traditional Architecture
- Architectural Shingle Roof
- Vinyl Siding
Interior Spaces
- 1,872 Sq Ft Home
- 2-Story Property
- Smooth Ceilings
- Popcorn or blown ceiling
- Ceiling Fan
- Gas Log Fireplace
- Entrance Foyer
- Family Room with Fireplace
- Separate Formal Living Room
- Formal Dining Room
Kitchen
- Eat-In Kitchen
- Electric Range
- Dishwasher
- Disposal
Flooring
- Carpet
- Ceramic Tile
Bedrooms and Bathrooms
- 3 Bedrooms
Laundry
- Laundry Room
- Washer and Electric Dryer Hookup
Outdoor Features
- Patio
Schools
- Westview Elementary And Middle School
- Stratford High School
Utilities
- Central Air
- Heat Pump System
Community Details
Overview
- Club Membership Available
- Crowfield Plantation Subdivision
Amenities
- Clubhouse
Recreation
- Golf Course Community
- Tennis Courts
- Fitness Center
- Community Pool
- Park
- Trails
Map
Home Values in the Area
Average Home Value in this Area
Tax History
| Year | Tax Paid | Tax Assessment Tax Assessment Total Assessment is a certain percentage of the fair market value that is determined by local assessors to be the total taxable value of land and additions on the property. | Land | Improvement |
|---|---|---|---|---|
| 2025 | $1,039 | $223,330 | $41,299 | $182,031 |
| 2024 | $1,015 | $8,933 | $1,652 | $7,281 |
| 2023 | $1,015 | $8,933 | $1,652 | $7,281 |
| 2022 | $1,202 | $7,768 | $1,800 | $5,968 |
| 2021 | $1,296 | $7,770 | $1,800 | $5,968 |
| 2020 | $1,238 | $7,768 | $1,800 | $5,968 |
| 2019 | $1,185 | $7,768 | $1,800 | $5,968 |
| 2018 | $1,083 | $6,788 | $1,600 | $5,188 |
| 2017 | $1,075 | $6,788 | $1,600 | $5,188 |
| 2016 | $1,083 | $6,790 | $1,600 | $5,190 |
| 2015 | $1,019 | $6,790 | $1,600 | $5,190 |
| 2014 | $615 | $5,660 | $1,600 | $4,060 |
| 2013 | -- | $5,660 | $1,600 | $4,060 |
Property History
| Date | Event | Price | List to Sale | Price per Sq Ft |
|---|---|---|---|---|
| 11/05/2025 11/05/25 | For Sale | $369,000 | -- | $197 / Sq Ft |
Purchase History
| Date | Type | Sale Price | Title Company |
|---|---|---|---|
| Deed | $169,000 | -- | |
| Deed Of Distribution | -- | -- | |
| Deed | $192,000 | None Available |
Mortgage History
| Date | Status | Loan Amount | Loan Type |
|---|---|---|---|
| Open | $135,200 | Future Advance Clause Open End Mortgage | |
| Previous Owner | $92,000 | Future Advance Clause Open End Mortgage |
Source: CHS Regional MLS
MLS Number: 25029663
APN: 243-06-02-019
Disclaimer: Certain information contained herein is derived from information provided by parties other than Homes.com. All information provided is deemed reliable, but is not guaranteed to be accurate and should be independently verified.
![]() The information is being provided by Charleston Trident MLS. Information deemed reliable but not guaranteed. Information is provided for consumers' personal, non-commercial use, and may not be used for any purpose other than the identification of potential properties for purchase. © 2025 Charleston Trident MLS. All Rights Reserved
The information is being provided by Charleston Trident MLS. Information deemed reliable but not guaranteed. Information is provided for consumers' personal, non-commercial use, and may not be used for any purpose other than the identification of potential properties for purchase. © 2025 Charleston Trident MLS. All Rights Reserved
- 147 Belleplaine Dr
- 102 Winding Rock Rd
- 109 Aldrich Place
- 135 Commons Way
- 201 Commons Way
- 203 Blenheim Ct
- 112 Amanda Cir
- 58 Indigo Ln
- 76 Indigo Ln
- 112 Edgewood Ln
- 109 Edgewood Ln
- 86 Indigo Ln
- 100 Iken Cir
- 101 N Warwick Trace
- 122 Hidden Fawn Cir
- 105 Birkbeck Ct
- 101 S Gateshead Crossing
- 363 Holly Ave
- 105 N Gateshead Crossing
- 103 S Norfolk Way
- 105 Queens Ct
- 72 Indigo Ln
- 131 Shropshire St
- 132 Alston Cir Unit AlstonCourt
- 204 Bridgecreek Dr
- 1019 Longview Dr
- 101 Bridgetown Rd
- 211 Pineview Dr
- 116 Etling Ave
- 100 N Pembroke Dr
- 202 St James Ave
- 105 Farm Rd
- 200 Branchwood Dr
- 1000 Crowfield Reserve Ln
- 104 Gainesborough Dr
- 2605 Elms Plantation Blvd
- 144 Carol Dr
- 130 Carol Dr
- 2510 Atlantic Palms Ln
- 3340 Shipley St
