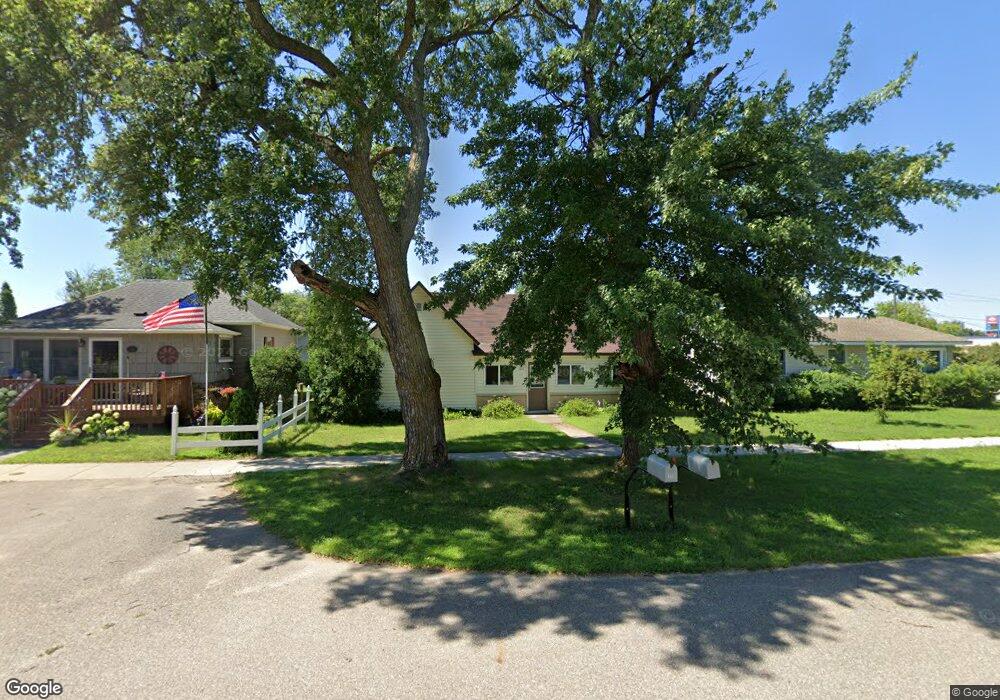
113 Birch Ave SE Menahga, MN 56464
Estimated Value: $154,000 - $170,000
3
Beds
1
Bath
1,008
Sq Ft
$161/Sq Ft
Est. Value
About This Home
This home is located at 113 Birch Ave SE, Menahga, MN 56464 and is currently estimated at $161,802, approximately $160 per square foot. 113 Birch Ave SE is a home located in Wadena County with nearby schools including Menahga Elementary School and Menahga High School.
Ownership History
Date
Name
Owned For
Owner Type
Purchase Details
Closed on
Jun 15, 2021
Sold by
Hagen Shawn and Hagen Laura Elaine
Bought by
Kolling Mark R
Current Estimated Value
Home Financials for this Owner
Home Financials are based on the most recent Mortgage that was taken out on this home.
Original Mortgage
$111,111
Outstanding Balance
$100,597
Interest Rate
2.9%
Mortgage Type
New Conventional
Estimated Equity
$61,205
Purchase Details
Closed on
Aug 21, 2009
Sold by
Torma Randy J and Torma Tammy
Bought by
Dissmore Laura
Home Financials for this Owner
Home Financials are based on the most recent Mortgage that was taken out on this home.
Original Mortgage
$65,790
Interest Rate
5.21%
Mortgage Type
New Conventional
Purchase Details
Closed on
May 4, 2009
Sold by
Citimorgage Inc
Bought by
Federal National Mortgage Association
Purchase Details
Closed on
Mar 19, 2009
Sold by
Federal National Mortgage Association
Bought by
Torma Randy J and Torma Tammy
Create a Home Valuation Report for This Property
The Home Valuation Report is an in-depth analysis detailing your home's value as well as a comparison with similar homes in the area
Purchase History
| Date | Buyer | Sale Price | Title Company |
|---|---|---|---|
| Kolling Mark R | $107,000 | None Available | |
| Dissmore Laura | $64,500 | None Available | |
| Federal National Mortgage Association | $87,036 | None Available | |
| Torma Randy J | -- | None Available | |
| Kolling Mark Mark | $107,000 | -- |
Source: Public Records
Mortgage History
| Date | Status | Borrower | Loan Amount |
|---|---|---|---|
| Open | Kolling Mark R | $111,111 | |
| Previous Owner | Dissmore Laura | $65,790 | |
| Closed | Kolling Mark Mark | $107,000 |
Source: Public Records
Tax History
| Year | Tax Paid | Tax Assessment Tax Assessment Total Assessment is a certain percentage of the fair market value that is determined by local assessors to be the total taxable value of land and additions on the property. | Land | Improvement |
|---|---|---|---|---|
| 2025 | $1,252 | $141,000 | $7,000 | $134,000 |
| 2024 | $1,252 | $121,800 | $5,600 | $116,200 |
| 2023 | $1,080 | $126,800 | $4,200 | $122,600 |
| 2022 | $876 | $94,300 | $4,200 | $90,100 |
| 2021 | $1,370 | $67,100 | $2,800 | $64,300 |
| 2020 | $1,372 | $62,200 | $2,800 | $59,400 |
| 2019 | $1,336 | $60,900 | $2,800 | $58,100 |
| 2018 | $1,298 | $58,300 | $2,800 | $55,500 |
| 2017 | $129 | $51,100 | $2,800 | $48,300 |
| 2016 | $1,286 | $50,078 | $2,744 | $47,334 |
| 2015 | $1,250 | $0 | $0 | $0 |
| 2014 | -- | $0 | $0 | $0 |
Source: Public Records
Map
Nearby Homes
- 18 Cedar Ave SE
- 316 Main St SE
- 618 1st St NE
- 32 Fir Ave NW
- 29 Fir Ave NW
- 44 Hickory Ave NW
- 520 Main St SW
- 851 E Blueberry River Dr
- ABC Aspen Ave S
- TBD E Blueberry River Dr
- 715 4th Ln NW
- TBD 141st Ave
- TBD Pine Cone Dr
- TBD 11th St SE
- TBD Freedom Dr
- TBD W Stocking Dr
- 14413 Blueberry Bridge Rd
- 39589 Park Dr Unit 22
- TBD Park Dr Unit 21
- 12075 Blueberry Loop Unit 28
- 18 1st St SE
- 117 Birch Ave SE
- 112 Aspen Ave SE
- 112 Aspen Ave S
- 19 1st St SE
- 19 SE Birch Ave SE
- 111 Aspen Ave SE
- 14 1st St SW
- 13 Birch Ave SE
- 215 1st St SE
- 16 Main St NE
- 00 Birch Ave SE
- 00 SE Birch Ave
- 116 Balsam Ave SW
- 120 Balsam Ave SW
- 111 Main St NE
- 111 Main St E
- 217 Aspen Ave SE
- 18 Main St SW
- 19 1st St SW
Your Personal Tour Guide
Ask me questions while you tour the home.