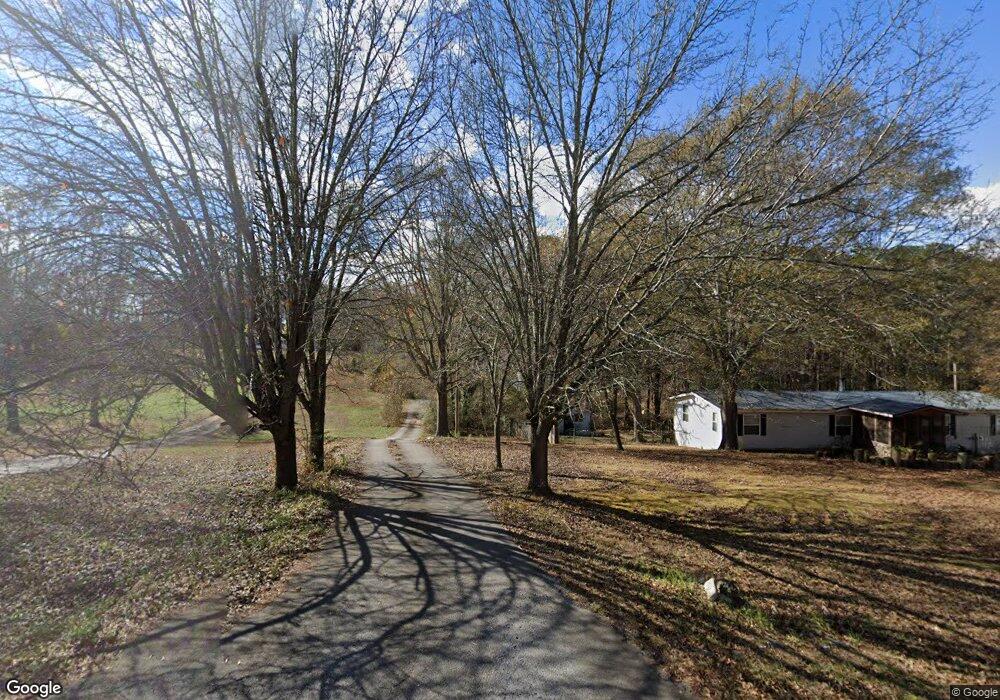
113 Bowman Mill Rd SE Winder, GA 30680
Estimated Value: $335,000 - $367,000
3
Beds
2
Baths
1,634
Sq Ft
$211/Sq Ft
Est. Value
About This Home
This home is located at 113 Bowman Mill Rd SE, Winder, GA 30680 and is currently estimated at $345,431, approximately $211 per square foot. 113 Bowman Mill Rd SE is a home located in Barrow County with nearby schools including Statham Elementary School, Bear Creek Middle School, and Winder-Barrow High School.
Ownership History
Date
Name
Owned For
Owner Type
Purchase Details
Closed on
Aug 17, 2011
Sold by
Secretary Of Housing And U
Bought by
Allen Arthur H
Current Estimated Value
Purchase Details
Closed on
Sep 7, 2010
Sold by
Wells Fargo Bk Na
Bought by
Hud-Housing Of Urban Dev
Purchase Details
Closed on
Aug 25, 2008
Sold by
Landers Scott D
Bought by
Landers Scott D and Landers Rebekah J
Home Financials for this Owner
Home Financials are based on the most recent Mortgage that was taken out on this home.
Original Mortgage
$186,444
Interest Rate
6.21%
Mortgage Type
FHA
Purchase Details
Closed on
Jun 24, 1997
Bought by
Landers Scott D And
Create a Home Valuation Report for This Property
The Home Valuation Report is an in-depth analysis detailing your home's value as well as a comparison with similar homes in the area
Home Values in the Area
Average Home Value in this Area
Purchase History
| Date | Buyer | Sale Price | Title Company |
|---|---|---|---|
| Allen Arthur H | $66,000 | -- | |
| Hud-Housing Of Urban Dev | -- | -- | |
| Wells Fargo Bk Na | $197,440 | -- | |
| Landers Scott D | -- | -- | |
| Landers Scott D And | -- | -- |
Source: Public Records
Mortgage History
| Date | Status | Borrower | Loan Amount |
|---|---|---|---|
| Previous Owner | Landers Scott D | $186,444 |
Source: Public Records
Tax History
| Year | Tax Paid | Tax Assessment Tax Assessment Total Assessment is a certain percentage of the fair market value that is determined by local assessors to be the total taxable value of land and additions on the property. | Land | Improvement |
|---|---|---|---|---|
| 2025 | $2,441 | $100,966 | $20,000 | $80,966 |
| 2024 | $2,389 | $96,740 | $18,000 | $78,740 |
| 2023 | $2,743 | $96,740 | $18,000 | $78,740 |
| 2022 | $1,923 | $67,006 | $18,000 | $49,006 |
| 2021 | $1,792 | $58,972 | $14,000 | $44,972 |
| 2020 | $1,557 | $50,938 | $10,000 | $40,938 |
| 2019 | $1,585 | $50,938 | $10,000 | $40,938 |
| 2018 | $1,454 | $50,938 | $10,000 | $40,938 |
| 2017 | $1,319 | $45,294 | $10,000 | $35,294 |
| 2016 | $1,225 | $44,354 | $10,000 | $34,354 |
| 2015 | $1,242 | $44,751 | $10,000 | $34,751 |
| 2014 | $1,109 | $40,048 | $4,900 | $35,148 |
| 2013 | -- | $37,502 | $4,900 | $32,602 |
Source: Public Records
Map
Nearby Homes
- 212 W Sycamore Dr
- 160 Azalea Dr
- 0 Bowman Mill Rd NE Unit 7698431
- 0 Bowman Mill Rd NE Unit 10664956
- 154 Azalea Dr
- 0 Giles Rd Unit 10539344
- 1200 Breckinridge Trail
- 276 Bowman Mill Rd SE
- 1209 Autumn Ave
- 00 Bird Hammond Rd
- 1283 Kesler Rd
- 246 Pleasant Hill Church Rd NE
- 316 Hardigree Dr
- 83 Beech Creek Cir
- 91 Beech Creek Cir
- 99 Beech Creek Cir
- 332 Hardigree Dr
- 88 Mockingbird Ln Unit 37
- 303 Mockingbird Ln Unit 22
- 66 Westlyn Way
- 113 Bowman Mill Rd SE
- 101 Bowman Mill Rd SE
- 153 Bowman Mill Rd SE
- 157 Bowman Mill Rd SE Unit 2
- 153 Bowman Mill Rd SE Unit 1
- 117 Bowman Mill Rd SE
- 95 Bowman Mill Rd SE
- 93 Bowman Mill Rd SE
- 396 E Sycamore Dr
- 394 E Sycamore Dr
- 1039 Bowman Way
- 1037 Bowman Way
- 1041 Bowman Way
- 1035 Bowman Way
- 392 E Sycamore Dr
- 397 E Sycamore Dr
- 167 Bowman Mill Rd SE
- 85 Bowman Mill Rd SE
- 1043 Bowman Way
- 390 E Sycamore Dr
Your Personal Tour Guide
Ask me questions while you tour the home.