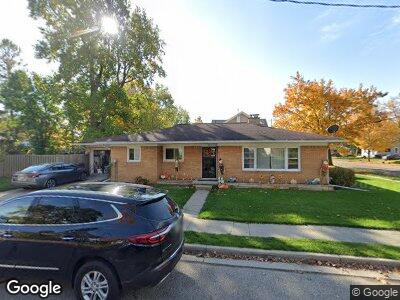
113 Carney St Unit 1 Leslie, MI 49251
Leslie NeighborhoodEstimated Value: $175,000 - $187,000
--
Bed
1
Bath
1,344
Sq Ft
$133/Sq Ft
Est. Value
About This Home
This home is located at 113 Carney St Unit 1, Leslie, MI 49251 and is currently estimated at $178,576, approximately $132 per square foot. 113 Carney St Unit 1 is a home located in Ingham County with nearby schools including Woodworth Elementary School, Leslie Middle School, and Leslie High School.
Ownership History
Date
Name
Owned For
Owner Type
Purchase Details
Closed on
Apr 14, 2014
Sold by
Toskey Abby J
Bought by
Thompson Jon
Current Estimated Value
Purchase Details
Closed on
Apr 23, 2009
Sold by
Mortgage Center Llc
Bought by
Toskey Abby J
Home Financials for this Owner
Home Financials are based on the most recent Mortgage that was taken out on this home.
Original Mortgage
$52,000
Interest Rate
5.05%
Mortgage Type
Purchase Money Mortgage
Purchase Details
Closed on
Jul 31, 2008
Sold by
Dunn James O and Dunn Karen E
Bought by
Mortgage Center Lc
Purchase Details
Closed on
Jul 19, 2002
Sold by
Hanson Jeffery T and Hanson Gloria A
Bought by
Dunn James O and Dunn Karen E
Home Financials for this Owner
Home Financials are based on the most recent Mortgage that was taken out on this home.
Original Mortgage
$127,070
Interest Rate
6.54%
Mortgage Type
Purchase Money Mortgage
Create a Home Valuation Report for This Property
The Home Valuation Report is an in-depth analysis detailing your home's value as well as a comparison with similar homes in the area
Home Values in the Area
Average Home Value in this Area
Purchase History
| Date | Buyer | Sale Price | Title Company |
|---|---|---|---|
| Thompson Jon | $82,000 | Lighthouse Title Inc | |
| Toskey Abby J | $65,000 | Mortgage Center Title Llc | |
| Mortgage Center Lc | $126,797 | None Available | |
| Dunn James O | $131,000 | First American Title |
Source: Public Records
Mortgage History
| Date | Status | Borrower | Loan Amount |
|---|---|---|---|
| Open | Fankhauser Briana L | $55,000 | |
| Previous Owner | Toskey Abby J | $52,000 | |
| Previous Owner | Dunn James O | $30,000 | |
| Previous Owner | Dunn James O | $127,070 | |
| Previous Owner | Hanson Jeff | $20,826 | |
| Previous Owner | Hanson Jeffrey T | $7,500 |
Source: Public Records
Tax History Compared to Growth
Tax History
| Year | Tax Paid | Tax Assessment Tax Assessment Total Assessment is a certain percentage of the fair market value that is determined by local assessors to be the total taxable value of land and additions on the property. | Land | Improvement |
|---|---|---|---|---|
| 2024 | $2,669 | $76,450 | $9,750 | $66,700 |
| 2023 | $2,669 | $66,900 | $9,750 | $57,150 |
| 2022 | $2,532 | $59,550 | $8,900 | $50,650 |
| 2021 | $2,505 | $55,650 | $6,950 | $48,700 |
| 2020 | $2,476 | $52,600 | $6,950 | $45,650 |
| 2019 | $2,537 | $51,150 | $6,950 | $44,200 |
| 2018 | $2,477 | $49,350 | $5,850 | $43,500 |
| 2017 | $2,397 | $49,350 | $5,850 | $43,500 |
| 2016 | -- | $47,850 | $5,450 | $42,400 |
| 2015 | -- | $43,800 | $10,023 | $33,777 |
| 2014 | -- | $43,450 | $10,580 | $32,870 |
Source: Public Records
Map
Nearby Homes
- 106 E Bellevue St
- 413 Meeker St
- 505 Kirby St
- 714 Mill St Unit 62
- 714 Mill St Unit 70
- 714 Mill St Unit 71
- 714 Mill St Unit 38
- 714 Mill St Unit 75
- 714 Mill St Unit 27
- 714 Mill St Unit 14
- 714 Mill St Unit 18
- 510 Maple St
- 4349 Cinnamon Ln
- 4940 State Rd
- VL Hull Rd St
- 3940 Tuttle Rd
- 4220 Wright Rd
- 0 Covert Rd
- 11808 Dutch Rd
- 1082 Kinneville Rd
- 113 Carney St Unit 1
- 113 Carney St
- 207 Armstrong St
- 209 Armstrong St
- 125 Armstrong St
- 109 Carney St
- 121 Armstrong St
- 208 Armstrong St
- 215 Armstrong St
- 200 Armstrong St
- 210 S Main St
- 119 Armstrong St
- 0 Carney Unit 201702457
- 0 Carney Unit M21032852
- 0 Carney Unit M21095686
- 214 Armstrong St
- 214 S Main St
- 207 Butler St
- 303 Armstrong St
- 206 Armstrong St