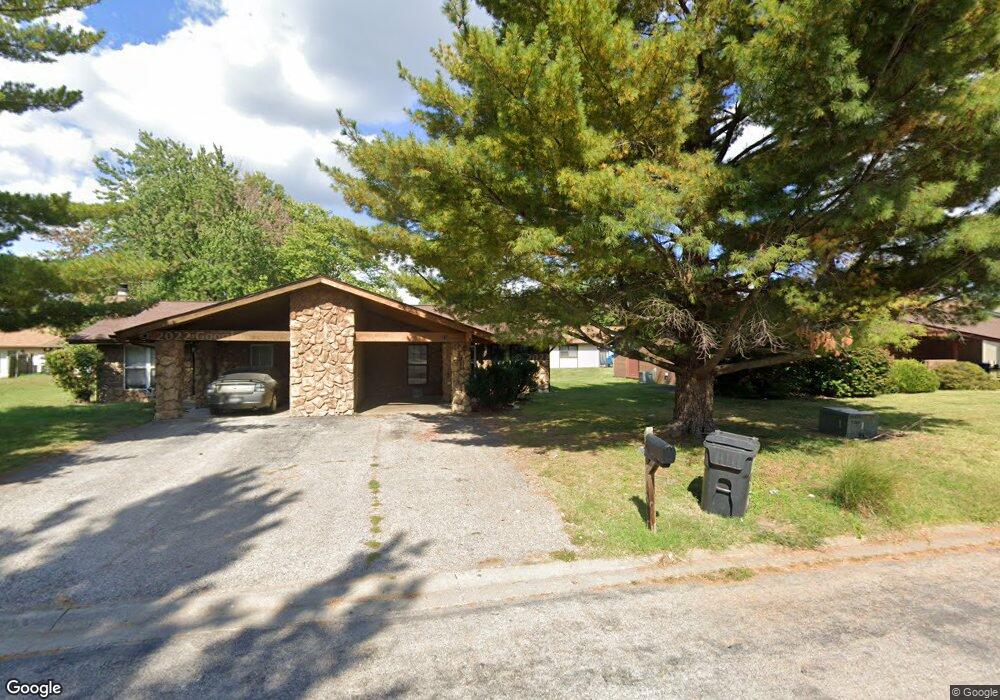
113 Chase Park Dr Belleville, IL 62226
Estimated Value: $95,000 - $114,527
--
Bed
--
Bath
1,050
Sq Ft
$96/Sq Ft
Est. Value
About This Home
This home is located at 113 Chase Park Dr, Belleville, IL 62226 and is currently estimated at $100,882, approximately $96 per square foot. 113 Chase Park Dr is a home located in St. Clair County with nearby schools including Union Elementary School, West Jr High School, and Our Lady Queen Of Peace Catholic School.
Ownership History
Date
Name
Owned For
Owner Type
Purchase Details
Closed on
Oct 30, 2014
Sold by
Stanley Ronald D
Bought by
Hall Jerell C
Current Estimated Value
Home Financials for this Owner
Home Financials are based on the most recent Mortgage that was taken out on this home.
Original Mortgage
$56,369
Outstanding Balance
$42,973
Interest Rate
3.87%
Mortgage Type
FHA
Estimated Equity
$57,909
Purchase Details
Closed on
May 24, 2006
Sold by
Noble Janet M
Bought by
Flanders Joseph and Flanders Theresa L
Home Financials for this Owner
Home Financials are based on the most recent Mortgage that was taken out on this home.
Original Mortgage
$53,000
Interest Rate
6.62%
Mortgage Type
Fannie Mae Freddie Mac
Purchase Details
Closed on
Nov 15, 2005
Sold by
Noble Ronald L and Noble Janet M
Bought by
Noble Janet M and Janet M Noble Revocable Trust
Create a Home Valuation Report for This Property
The Home Valuation Report is an in-depth analysis detailing your home's value as well as a comparison with similar homes in the area
Home Values in the Area
Average Home Value in this Area
Purchase History
| Date | Buyer | Sale Price | Title Company |
|---|---|---|---|
| Hall Jerell C | $60,000 | Community Title Shiloh Llc | |
| Flanders Joseph | $59,000 | Fatic | |
| Noble Janet M | -- | First American Title Insuran |
Source: Public Records
Mortgage History
| Date | Status | Borrower | Loan Amount |
|---|---|---|---|
| Open | Hall Jerell C | $56,369 | |
| Previous Owner | Flanders Joseph | $53,000 |
Source: Public Records
Tax History Compared to Growth
Tax History
| Year | Tax Paid | Tax Assessment Tax Assessment Total Assessment is a certain percentage of the fair market value that is determined by local assessors to be the total taxable value of land and additions on the property. | Land | Improvement |
|---|---|---|---|---|
| 2024 | $1,949 | $26,196 | $4,654 | $21,542 |
| 2023 | $1,814 | $22,996 | $4,592 | $18,404 |
| 2022 | $1,694 | $20,943 | $4,182 | $16,761 |
| 2021 | $1,674 | $20,083 | $4,010 | $16,073 |
| 2020 | $1,621 | $18,703 | $3,734 | $14,969 |
| 2019 | $1,637 | $19,349 | $3,883 | $15,466 |
| 2018 | $1,610 | $18,855 | $3,784 | $15,071 |
| 2017 | $1,582 | $18,353 | $3,683 | $14,670 |
| 2016 | $1,586 | $17,720 | $3,556 | $14,164 |
| 2014 | $1,310 | $16,504 | $3,560 | $12,944 |
| 2013 | $1,624 | $16,504 | $3,560 | $12,944 |
Source: Public Records
Map
Nearby Homes
- 102 Kensington Heights Rd
- 22 Elizabeth Dr
- 11 Kingsway Dr
- 41 Paulette Dr
- 119 Freedom Dr
- 2819 Frank Scott Pkwy W
- 128 Freedom Dr
- 4619 Ruth St
- 40 Irene Dr
- 4720 Ruth St
- 8 S 51st St
- 18 Jonathon Lee Dr
- 6204 Warren Dr
- 130 Hickory Lake
- 44 Gatewood Ct
- 22 Terrace Dr
- 20 S 44th St
- 2264 Frank Scott Pkwy W
- 140 Willow Creek Rd
- 408 Rosewood Ct
- 113 -115 Chase Park Dr
- 115 Chase Park Dr
- 109 Chase Park Dr
- 109 Chase Park Dr Unit 2
- 109 Chase Park Dr Unit 2
- 117 Chase Park Dr
- 111 Chase Park Dr
- 108 Kingsway Dr
- 107 Chase Park Dr
- 116 Kingsway Dr
- 112 Chase Park Dr Unit 114
- 110 Chase Park Dr
- 118 Kingsway Dr
- 121 Chase Park Dr
- 105 Chase Park Dr
- 108 Chase Park Dr
- 123 Chase Park Dr