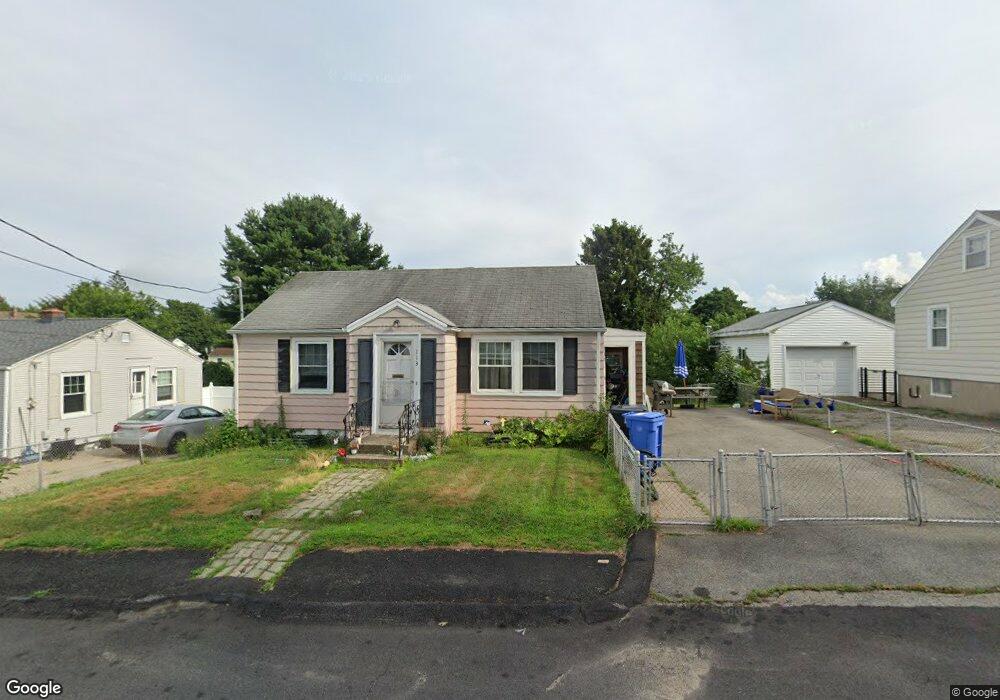
113 Clark St Cumberland, RI 02864
Valley Falls NeighborhoodEstimated Value: $285,071 - $354,000
2
Beds
1
Bath
768
Sq Ft
$416/Sq Ft
Est. Value
About This Home
This home is located at 113 Clark St, Cumberland, RI 02864 and is currently estimated at $319,268, approximately $415 per square foot. 113 Clark St is a home located in Providence County with nearby schools including B.F. Norton Elementary School, Joseph L. McCourt Middle School, and Cumberland High School.
Ownership History
Date
Name
Owned For
Owner Type
Purchase Details
Closed on
Jan 14, 2022
Sold by
Barlow Carol A
Bought by
Brown Kathleen and Brown Ryan K
Current Estimated Value
Home Financials for this Owner
Home Financials are based on the most recent Mortgage that was taken out on this home.
Original Mortgage
$140,000
Outstanding Balance
$127,856
Interest Rate
3.05%
Mortgage Type
Purchase Money Mortgage
Estimated Equity
$191,412
Create a Home Valuation Report for This Property
The Home Valuation Report is an in-depth analysis detailing your home's value as well as a comparison with similar homes in the area
Home Values in the Area
Average Home Value in this Area
Purchase History
| Date | Buyer | Sale Price | Title Company |
|---|---|---|---|
| Brown Kathleen | $175,000 | None Available | |
| Brown Kathleen | $175,000 | None Available |
Source: Public Records
Mortgage History
| Date | Status | Borrower | Loan Amount |
|---|---|---|---|
| Open | Brown Kathleen | $140,000 | |
| Closed | Brown Kathleen | $140,000 |
Source: Public Records
Tax History
| Year | Tax Paid | Tax Assessment Tax Assessment Total Assessment is a certain percentage of the fair market value that is determined by local assessors to be the total taxable value of land and additions on the property. | Land | Improvement |
|---|---|---|---|---|
| 2025 | $2,838 | $231,300 | $132,800 | $98,500 |
| 2024 | $2,764 | $231,300 | $132,800 | $98,500 |
| 2023 | $2,688 | $231,300 | $132,800 | $98,500 |
| 2022 | $2,604 | $173,700 | $92,900 | $80,800 |
| 2021 | $4,201 | $173,700 | $92,900 | $80,800 |
| 2020 | $4,188 | $173,700 | $92,900 | $80,800 |
| 2019 | $4,378 | $159,300 | $77,500 | $81,800 |
| 2018 | $522 | $159,300 | $77,500 | $81,800 |
| 2017 | $2,423 | $159,300 | $77,500 | $81,800 |
| 2016 | $2,297 | $134,500 | $69,400 | $65,100 |
| 2015 | $2,297 | $134,500 | $69,400 | $65,100 |
| 2014 | $4,422 | $134,500 | $69,400 | $65,100 |
| 2013 | $2,627 | $166,500 | $73,200 | $93,300 |
Source: Public Records
Map
Nearby Homes
- 23 Hewes St
- 134 Dexter St
- 28 Crowell St
- 517 Mendon Rd Unit 517
- 36 Dexter St
- 513 Mendon Rd Unit 513
- 515 Mendon Rd Unit 515
- 500 Mendon Rd Unit 257
- 511 Mendon Rd Unit 511
- 509 Mendon Rd Unit 509
- 18 Cumberland St
- 6 Castle Rd
- 47 Castle Rd
- 26 Hopkins Terrace
- 416 Brown St
- 50 Blackstone St
- 31 Prospect St Unit 1
- 29 Prospect St Unit 2
- 27 Prospect St
- 25 Prospect St
Your Personal Tour Guide
Ask me questions while you tour the home.