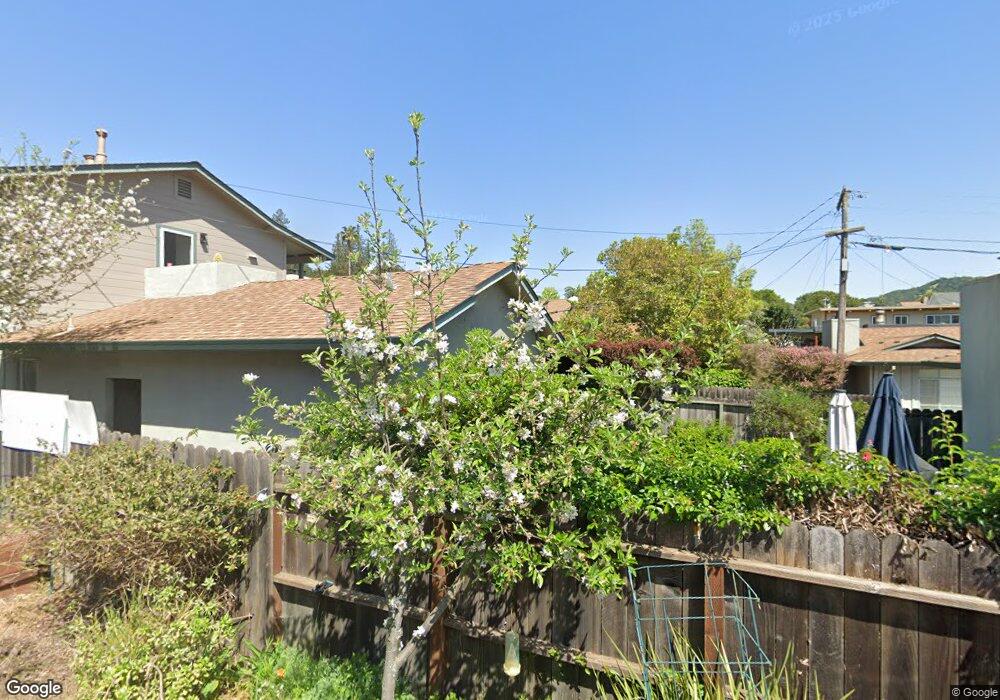
113 Clorinda Ave San Rafael, CA 94901
Gerstle Park NeighborhoodEstimated Value: $1,086,000 - $1,275,000
3
Beds
2
Baths
1,712
Sq Ft
$701/Sq Ft
Est. Value
About This Home
This home is located at 113 Clorinda Ave, San Rafael, CA 94901 and is currently estimated at $1,200,579, approximately $701 per square foot. 113 Clorinda Ave is a home located in Marin County with nearby schools including Sun Valley Elementary School, James B. Davidson Middle School, and San Rafael High School.
Ownership History
Date
Name
Owned For
Owner Type
Purchase Details
Closed on
Jan 29, 2025
Sold by
Wohl Michelle
Bought by
Michelle Wohl Family Trust and Wohl
Current Estimated Value
Purchase Details
Closed on
Oct 25, 2016
Sold by
Velcich Kathie Joan
Bought by
Wohl Arlene and Wohl Michelle
Purchase Details
Closed on
Mar 14, 2016
Sold by
Velcich Kathie Joan and Velcich Gloria Jean
Bought by
Velcick Kathie Joan
Purchase Details
Closed on
Dec 19, 2008
Sold by
Velcich Rena K
Bought by
Velcich Rena
Purchase Details
Closed on
Apr 3, 2001
Sold by
John Velcich
Bought by
Velcich John and Velcich Rena K
Create a Home Valuation Report for This Property
The Home Valuation Report is an in-depth analysis detailing your home's value as well as a comparison with similar homes in the area
Home Values in the Area
Average Home Value in this Area
Purchase History
| Date | Buyer | Sale Price | Title Company |
|---|---|---|---|
| Michelle Wohl Family Trust | -- | None Listed On Document | |
| Wohl Arlene | $745,000 | Old Republic Title Co | |
| Velcick Kathie Joan | -- | None Available | |
| Velcich Rena | -- | None Available | |
| Velcich John | -- | -- |
Source: Public Records
Tax History Compared to Growth
Tax History
| Year | Tax Paid | Tax Assessment Tax Assessment Total Assessment is a certain percentage of the fair market value that is determined by local assessors to be the total taxable value of land and additions on the property. | Land | Improvement |
|---|---|---|---|---|
| 2025 | $11,542 | $864,617 | $522,252 | $342,365 |
| 2024 | $11,542 | $847,667 | $512,014 | $335,653 |
| 2023 | $11,337 | $831,047 | $501,975 | $329,072 |
| 2022 | $10,710 | $814,753 | $492,133 | $322,620 |
| 2021 | $10,547 | $798,781 | $482,485 | $316,296 |
| 2020 | $10,502 | $790,594 | $477,540 | $313,054 |
| 2019 | $10,595 | $775,098 | $468,180 | $306,918 |
| 2018 | $10,550 | $759,900 | $459,000 | $300,900 |
| 2017 | $10,169 | $745,000 | $450,000 | $295,000 |
| 2016 | $3,809 | $200,572 | $24,255 | $176,317 |
| 2015 | $3,646 | $197,559 | $23,891 | $173,668 |
| 2014 | $3,473 | $193,690 | $23,423 | $170,267 |
Source: Public Records
Map
Nearby Homes