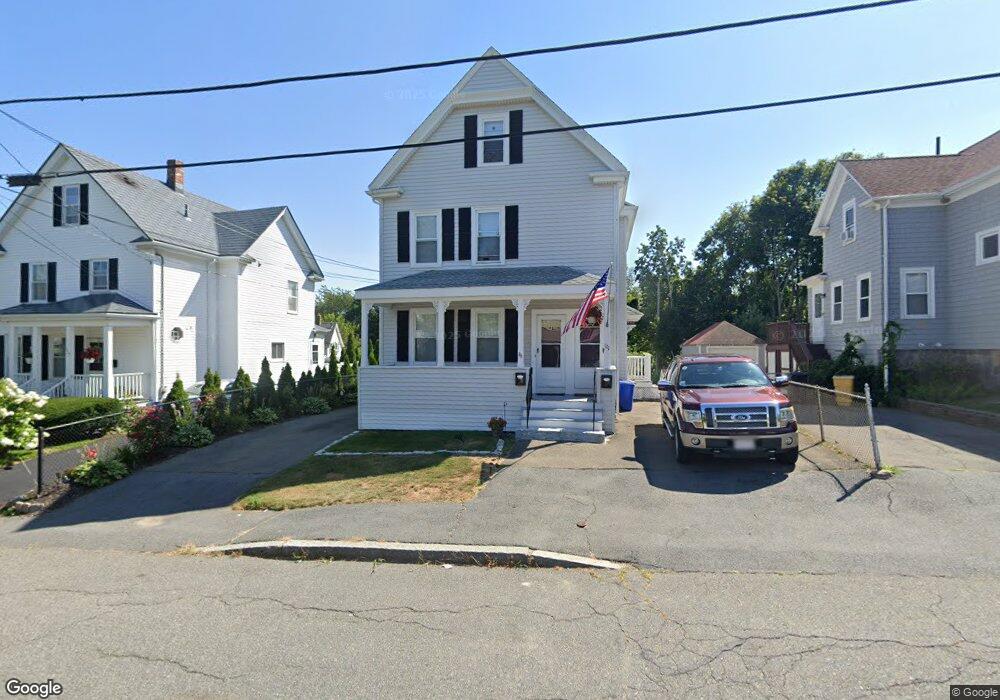
113 Cranch St Unit 113 Quincy, MA 02169
Quincy Center NeighborhoodEstimated Value: $856,476 - $1,003,000
2
Beds
1
Bath
1,000
Sq Ft
$930/Sq Ft
Est. Value
About This Home
This home is located at 113 Cranch St Unit 113, Quincy, MA 02169 and is currently estimated at $930,119, approximately $930 per square foot. 113 Cranch St Unit 113 is a home located in Norfolk County with nearby schools including Charles A. Bernazzani Elementary School, Central Middle School, and Quincy High School.
Ownership History
Date
Name
Owned For
Owner Type
Purchase Details
Closed on
Apr 27, 2015
Sold by
Campbell Paul G
Bought by
Campbell Ft and Campbell Paul G
Current Estimated Value
Purchase Details
Closed on
Jul 19, 1984
Bought by
Campbell Paul G and Campbell Shearing
Create a Home Valuation Report for This Property
The Home Valuation Report is an in-depth analysis detailing your home's value as well as a comparison with similar homes in the area
Home Values in the Area
Average Home Value in this Area
Purchase History
| Date | Buyer | Sale Price | Title Company |
|---|---|---|---|
| Campbell Ft | -- | -- | |
| Campbell Paul G | -- | -- | |
| Campbell Paul G | -- | -- |
Source: Public Records
Mortgage History
| Date | Status | Borrower | Loan Amount |
|---|---|---|---|
| Previous Owner | Campbell Paul G | $820,000 |
Source: Public Records
Tax History Compared to Growth
Tax History
| Year | Tax Paid | Tax Assessment Tax Assessment Total Assessment is a certain percentage of the fair market value that is determined by local assessors to be the total taxable value of land and additions on the property. | Land | Improvement |
|---|---|---|---|---|
| 2025 | $8,547 | $741,300 | $270,200 | $471,100 |
| 2024 | $8,047 | $714,000 | $257,300 | $456,700 |
| 2023 | $7,526 | $676,200 | $233,900 | $442,300 |
| 2022 | $7,493 | $625,500 | $212,700 | $412,800 |
| 2021 | $7,628 | $628,300 | $212,700 | $415,600 |
| 2020 | $7,433 | $598,000 | $202,500 | $395,500 |
| 2019 | $7,078 | $564,000 | $191,100 | $372,900 |
| 2018 | $6,807 | $510,300 | $191,100 | $319,200 |
| 2017 | $6,855 | $483,800 | $182,000 | $301,800 |
| 2016 | $6,265 | $436,300 | $173,300 | $263,000 |
| 2015 | $6,167 | $422,400 | $173,300 | $249,100 |
| 2014 | -- | $362,300 | $165,000 | $197,300 |
Source: Public Records
Map
Nearby Homes
- 293 Whitwell St
- 73 Scotch Pond Place
- 73 Cranch St Unit 73
- 195 Thomas Burgin Pkwy Unit 205
- 118 Dimmock St
- 215 Thomas Burgin Pkwy Unit 35
- 165 Granite St
- 18 Cliveden St Unit 201W
- 33 Brook Rd
- 2 Cliveden St Unit 601E
- 64 Garfield St Unit B
- 1 Adams St Unit 502
- 20 Whitney Rd
- 20 Whitney Rd Unit 307
- 20 Whitney Rd Unit 101
- 77 Adams St Unit 610
- 8 Jackson St Unit B2
- 94 Brook Rd Unit 3
- 312 Adams St
- 1 Cityview Ln Unit 204