$685,000

113 E 2nd St Tilden, NE 68781

Estimated payment $3,884/month

Total Views 134
7 Beds
7 Baths
-- Sq Ft
-- Price per Sq Ft

About This Home

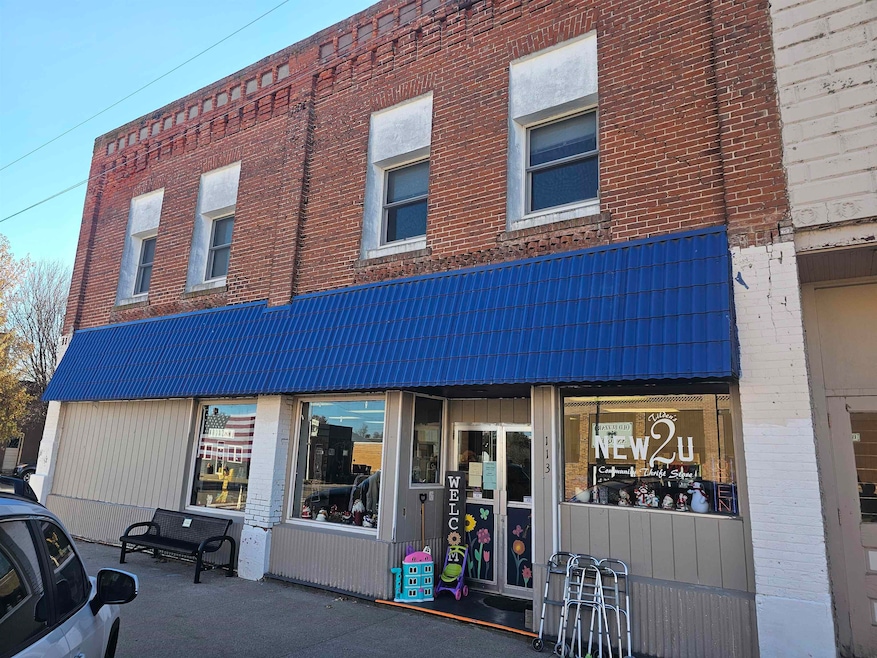
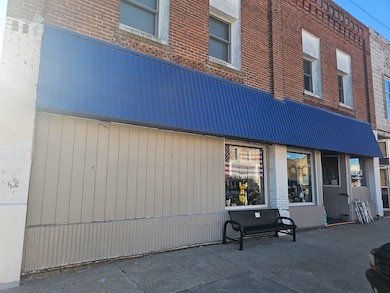
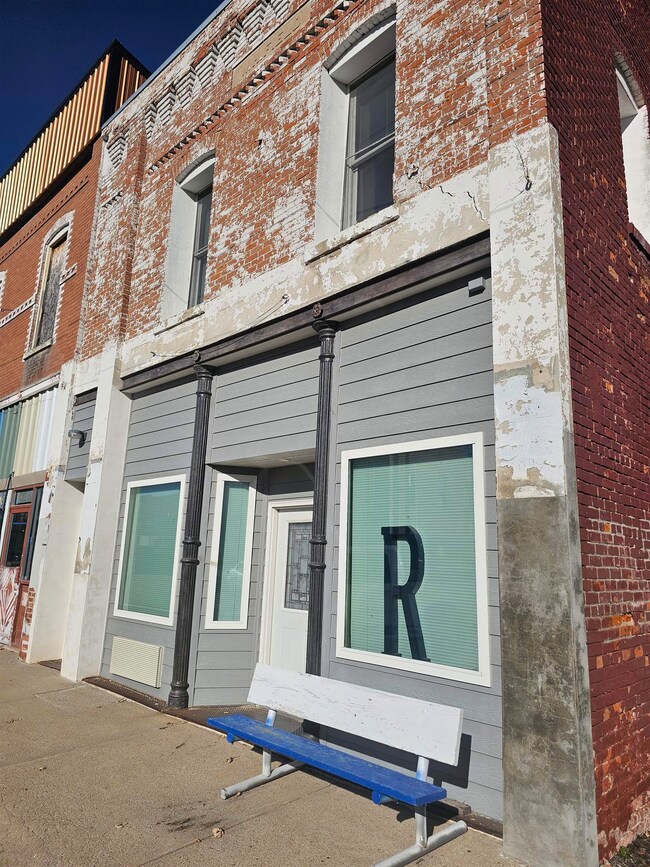
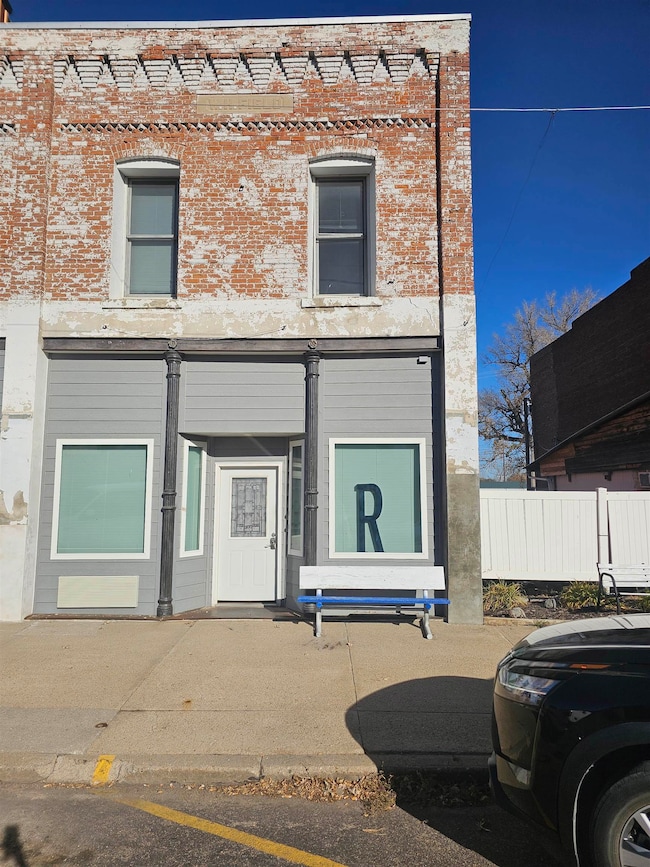
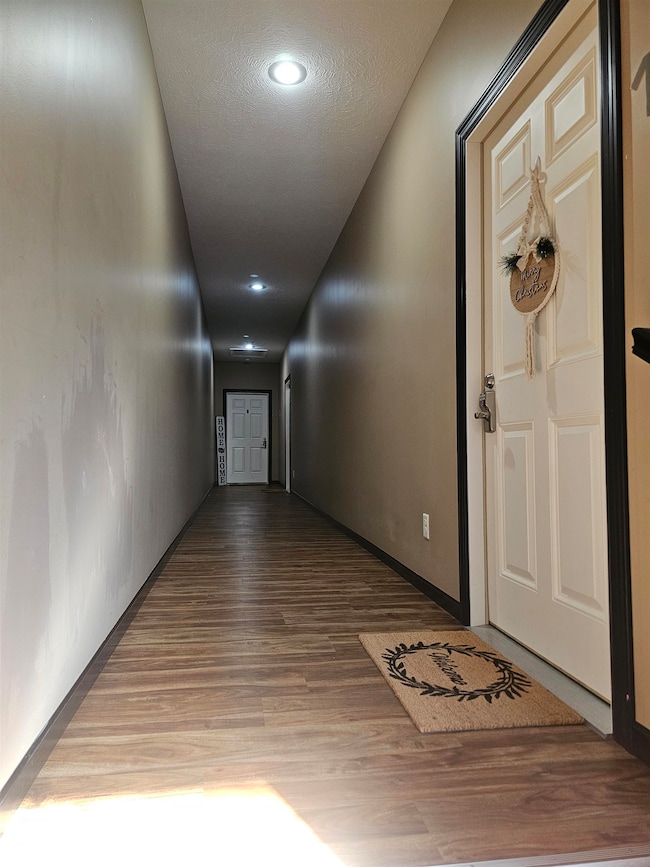
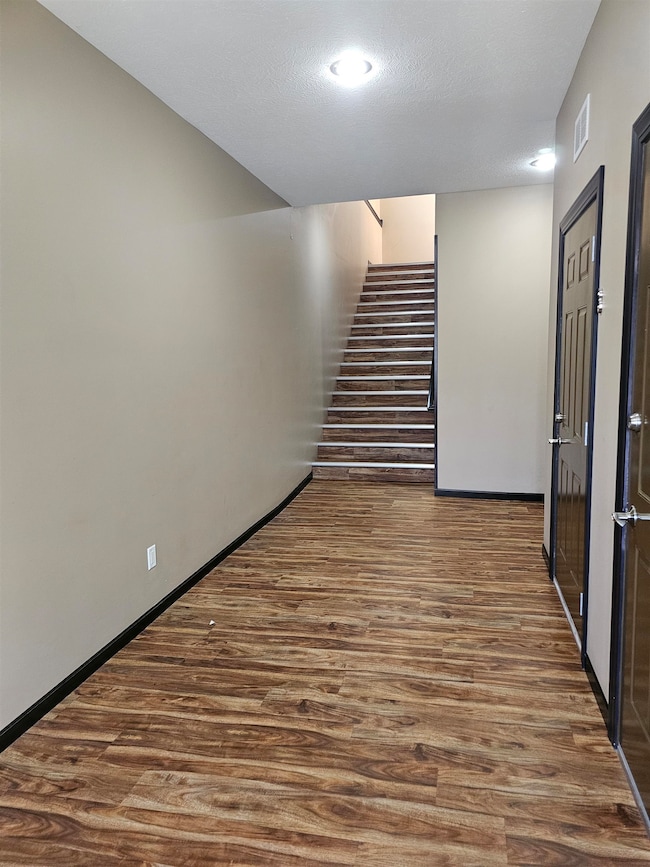
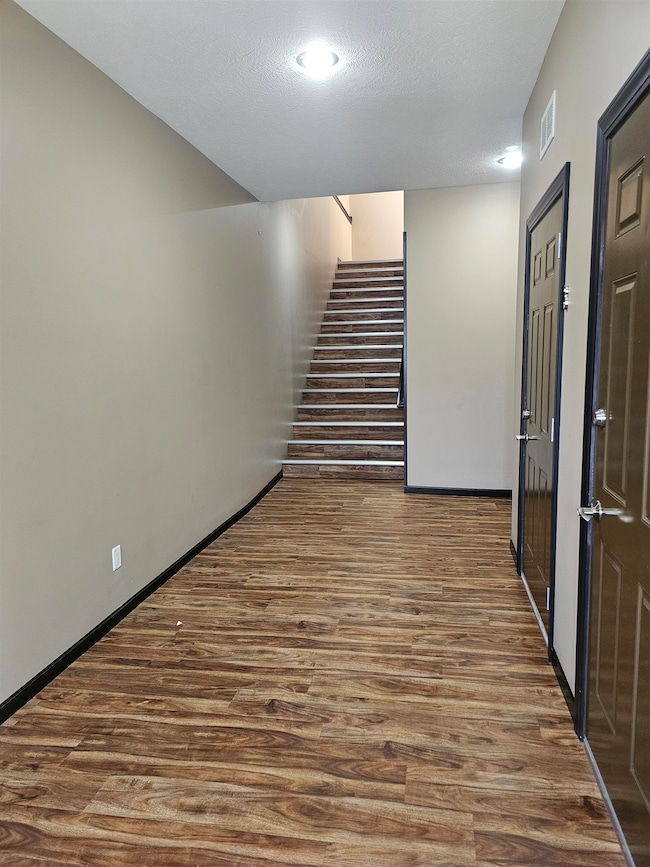
110 & 113 E 2nd Street in Tilden present a great opportunity to own two updated investment properties in the heart of town. 110 E 2nd St features three apartments plus one efficiency unit. 113 E 2nd St includes three apartments and a commercial space, offering a versatile mix of residential and business potential. Both buildings have newly updated living areas and improved systems, creating clean, modern, and functional spaces that are ready for tenants or owner-use. With multiple units and flexible layouts, these properties offer strong income potential. The seller would like to have the option of a 1031 exchange.

Listing Agent

Russ Wilcox

Real Estate Solutions Team License #20170232 Listed on: 11/14/2025

Property Details

Home Type

  • Multi-Family

Est. Annual Taxes

  • $3,273

Home Design

  • Flat Roof Shape
  • Brick Exterior Construction
  • Asphalt Roof

Bedrooms and Bathrooms

  • 7 Bedrooms

Listing and Financial Details

  • The owner pays for water, garbage

Property Details

Home Type

Multi-Family

Est. Annual Taxes

$3,273

Lot Details

0

Listing Details

  • Class: MULTI-FAMILY
  • Style: Other
  • Miscellaneous: Separate Meters, Indiv Watr Heat, Individual Heat, Individual Air, Security Depost
  • Safety Features: Smoke Detector
  • Special Features: None
  • Property Sub Type: MultiFamily

Interior Features

  • Appliances: Applies To Some, Refrigerator, Stove, Washer-Connectn
  • Bedrooms: 7
  • Bathrooms: 7
  • Has Basement: Yes
  • Stories: Two
  • Unit Features: Applies To Some, Liv/Din Combo, Kit/Din Combo, Inside Util Rm, Washr/Dry Hkups, Priv Outsd Entr, Comn Outsid Ent, Private Bath, Extra Storage

Exterior Features

  • Construction: Brick
  • Roof: Asphalt, Flat

Garage/Parking

  • Garage Type: None
  • Utilities Paid By Owner: Water, Garbage
  • Utilities Paid By Renter: Electricity, Cable
  • Water And Sewer: City Water, City Sewer

Utilities

  • Utilities: Separate

Tax Info

  • Taxes: 3272.58

Map

Range of Values:

--
Value Increase
--
Percent Increase
--
Adjusted for Inflation
Collateral Analytics

Collateral Analytics Collateral Analytics AVMs (Automated Valuation Model) employ a number of statistical approaches combined with neighborhood-specific comparable selection guarantees the most up-to-date and precise valuations.

Not Available

Collateral Analytics does not have data for the current month. Please view the chart for historical values.

ICE

ICE Mortgage Technology ICE Mortgage Technology’s AVM (Automated Valuation Model) is a state-of-the-art online residential property valuation tool that provides a quick and accurate estimate of the value of almost any home in the U.S.

Not Available

ICE Mortgage Technology does not have data for the current month. Please view the chart for historical values.

First American

First American First American Data & Analytics’ next-generation AVM combines unrivaled data assets with a blended ensemble of valuation models to produce highly accurate, reliable valuations you can trust.

Not Available

First American does not have data for the current month. Please view the chart for historical values.

Quantarium

Quantarium Quantarium’s valuation service, repeatedly proven the industry’s most accurate and comprehensive, is supercharged with a self-learning and auto-tuning AI engine that continually becomes smarter and more accurate as it processes daily inputs from the industry’s leading RE data lake.

Not Available

Quantarium does not have data for the current month. Please view the chart for historical values.

Average Value
Not Available
List Price
Sold Price
Create a Home Valuation Report for This Property
The Home Valuation Report is an in-depth analysis detailing your home's value as well as a comparison with similar homes in the area

Home Values in the Area

Source: Public Records

Average Home Value in this Area


Source: Public Records

Tax History

Year Tax Paid Tax Assessment Tax Assessment Total Assessment is a certain percentage of the fair market value that is determined by local assessors to be the total taxable value of land and additions on the property. Land Improvement
2024 $2,253 $154,823 $6,136 $148,687
2023 $3,174 $154,823 $6,136 $148,687
2022 $3,174 $154,823 $6,136 $148,687
2021 $3,079 $157,370 $6,136 $151,234
2020 $3,181 $157,370 $6,136 $151,234
2019 $3,143 $157,370 $6,136 $151,234
2018 $3,222 $160,457 $6,136 $154,321
2017 $819 $69,952 $6,136 $63,816
2016 $835 $40,860 $6,136 $34,724
2015 $824 $40,860 $6,136 $34,724
2014 $845 $40,860 $6,136 $34,724
2013 $947 $40,860 $6,136 $34,724
Source: Public Records

Property History

Date Event Price List to Sale Price per Sq Ft
11/14/2025 11/14/25 For Sale $685,000 -- --
Source: Norfolk Board of REALTORS®

Source: Norfolk Board of REALTORS®

MLS Number: 250839

Norfolk Board of REALTORS®

APN: 590030396