
Seller's Agent in 2020
Courtney Marsh
Red Door Realty Group Inc
(618) 900-0082
427 Total Sales
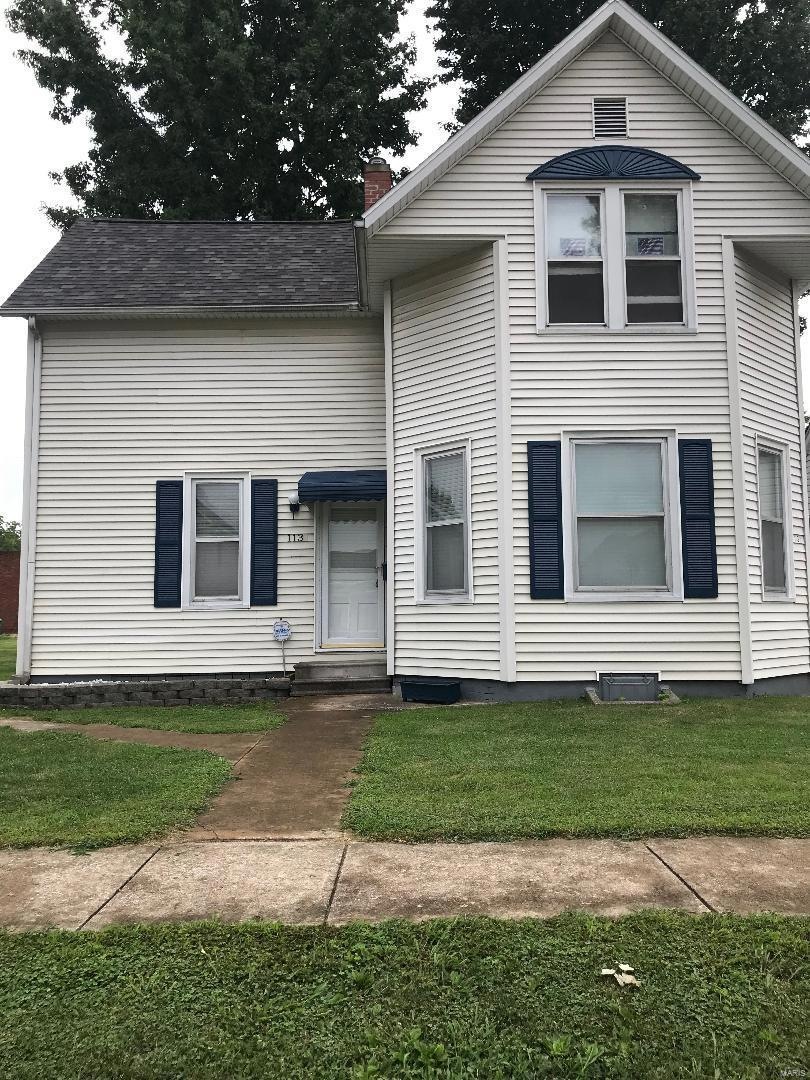
Great investment opportunity. triplex in the well sought after O'fallon area. One of Southern Illinois hottest emerging areas! This property is well maintained, has good tenants & income. Lower level unit is excellent for owner occupant or has previously been leased.The front 2-story building has 2 spacious 1 bd/1bth units. First floor unit has access to full basement & washer & dryer area in kitchen. The third rental, located off the alley in the back , is a 1 bd/1bth cottage with a detached 2-car garage.
Last Agent to Sell the Property
Real Estate Pro's, LLC License #471015368 Listed on: 07/29/2018
Last Buyer's Agent
Joni Bugger
Re/Max Signature Properties License #475157254
Home Type
Est. Annual Taxes
Year Built
Home Design
Parking
Utilities
Additional Features
Listing and Financial Details
| Date | Type | Sale Price | Title Company |
|---|---|---|---|
| Interfamily Deed Transfer | -- | Benedick Title Ins | |
| Warranty Deed | $123,000 | Benedick Title Ins | |
| Warranty Deed | $120,500 | Advanced Title Solutions Inc | |
| Warranty Deed | $88,500 | -- |
| Date | Status | Loan Amount | Loan Type |
|---|---|---|---|
| Closed | $760,000 | Commercial | |
| Closed | $92,250 | New Conventional | |
| Previous Owner | $93,450 | Commercial | |
| Previous Owner | $33,000 | Unknown | |
| Previous Owner | $86,777 | Unknown | |
| Previous Owner | $85,336 | FHA |
| Date | Event | Price | Change | Sq Ft Price |
|---|---|---|---|---|
| 04/17/2020 04/17/20 | Sold | $123,000 | -5.3% | $64 / Sq Ft |
| 02/26/2020 02/26/20 | For Sale | $129,900 | +10.1% | $68 / Sq Ft |
| 10/19/2018 10/19/18 | Sold | $118,000 | -8.5% | $175 / Sq Ft |
| 08/01/2018 08/01/18 | Pending | -- | -- | -- |
| 07/29/2018 07/29/18 | For Sale | $128,900 | 0.0% | $192 / Sq Ft |
| 12/30/2014 12/30/14 | Rented | $475 | 0.0% | -- |
| 12/30/2014 12/30/14 | For Rent | $475 | -- | -- |
| Year | Tax Paid | Tax Assessment Tax Assessment Total Assessment is a certain percentage of the fair market value that is determined by local assessors to be the total taxable value of land and additions on the property. | Land | Improvement |
|---|---|---|---|---|
| 2023 | $3,989 | $52,655 | $3,914 | $48,741 |
| 2022 | $3,773 | $48,409 | $3,598 | $44,811 |
| 2021 | $3,707 | $46,691 | $3,610 | $43,081 |
| 2020 | $3,682 | $44,197 | $3,417 | $40,780 |
| 2019 | $3,603 | $44,197 | $3,417 | $40,780 |
| 2018 | $3,510 | $42,914 | $3,318 | $39,596 |
| 2017 | $3,610 | $42,555 | $3,460 | $39,095 |
| 2016 | $3,600 | $41,561 | $3,379 | $38,182 |
| 2014 | $3,334 | $41,080 | $3,340 | $37,740 |
| 2013 | $2,207 | $41,953 | $3,289 | $38,664 |
Seller's Agent in 2020
Courtney Marsh
Red Door Realty Group Inc
(618) 900-0082
427 Total Sales
Buyer's Agent in 2020
Andy Pelak
RE/MAX Preferred
(618) 567-6676
S
Seller's Agent in 2018
Sharon Zrenner
Real Estate Pro's, LLC
(618) 567-4299
52 Total Sales
Buyer's Agent in 2018
Joni Bugger
RE/MAX
(618) 772-9272
84 Total Sales
Source: MARIS MLS
MLS Number: MIS18061514
APN: 04-29.0-314-006
Disclaimer: Certain information contained herein is derived from information provided by parties other than Homes.com. All information provided is deemed reliable, but is not guaranteed to be accurate and should be independently verified.
![]() Based on information submitted to the MLS GRID. All data is obtained from various sources and may not have been verified by broker or MLS GRID. Supplied Open House Information is subject to change without notice. All information should be independently reviewed and verified for accuracy. Properties may or may not be listed by the office/agent presenting the information. Some IDX listings have been excluded from this website.
Based on information submitted to the MLS GRID. All data is obtained from various sources and may not have been verified by broker or MLS GRID. Supplied Open House Information is subject to change without notice. All information should be independently reviewed and verified for accuracy. Properties may or may not be listed by the office/agent presenting the information. Some IDX listings have been excluded from this website.
The Digital Millennium Copyright Act of 1998, 17 U.S.C. § 512 (the “DMCA”) provides recourse for copyright owners who believe that material appearing on the Internet infringes their rights under U.S. copyright law. If you believe in good faith that any content or material made available in connection with our website or services infringes your copyright, you (or your agent) may send us a notice requesting that the content or material be removed, or access to it blocked.
Notices must be sent in writing by email to DMCAnotice@MLSGrid.com.
The DMCA requires that your notice of alleged copyright infringement include the following information:
(1) description of the copyrighted work that is the subject of claimed infringement;
(2) description of the alleged infringing content and information sufficient to permit us to locate the content;
(3) contact information for you, including your address, telephone number and email address;
(4) a statement by you that you have a good faith belief that the content in the manner complained of is not authorized by the copyright owner, or its agent, or by the operation of any law;
(5) a statement by you, signed under penalty of perjury, that the information in the notification is accurate and that you have the authority to enforce the copyrights that are claimed to be infringed; and
(6) a physical or electronic signature of the copyright owner or a person authorized to act on the copyright owner’s behalf. Failure to include all of the above information may result in the delay of the processing of your complaint.