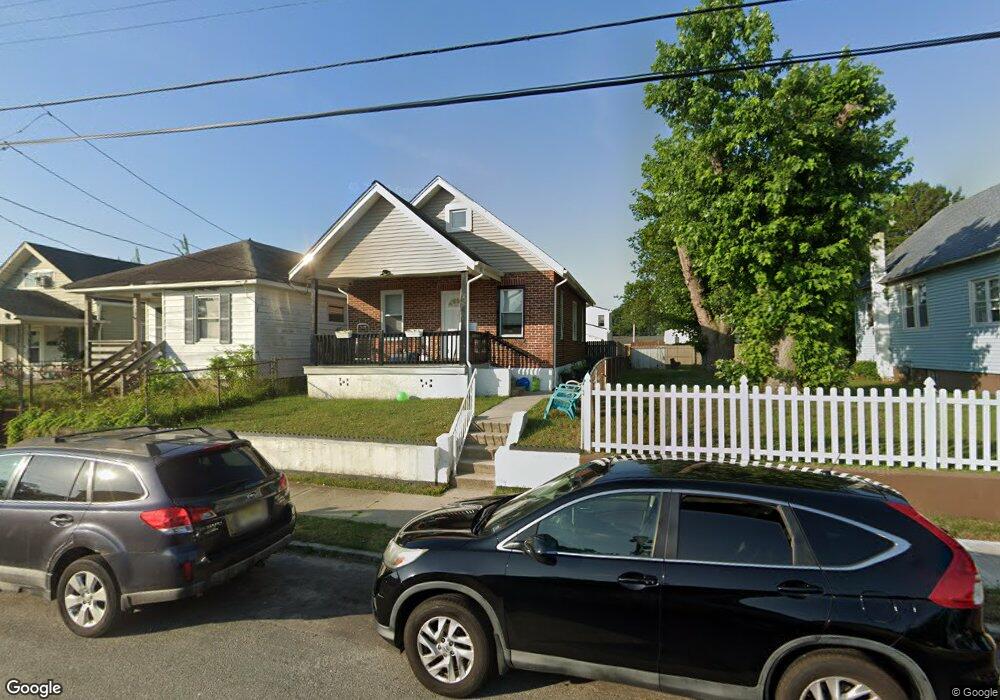
113 E Edgewater Ave Pleasantville, NJ 08232
Estimated Value: $139,000 - $250,000
2
Beds
1
Bath
748
Sq Ft
$245/Sq Ft
Est. Value
About This Home
This home is located at 113 E Edgewater Ave, Pleasantville, NJ 08232 and is currently estimated at $183,019, approximately $244 per square foot. 113 E Edgewater Ave is a home located in Atlantic County with nearby schools including Pleasantville High School and Life Point Academy/ Life Point Church.
Ownership History
Date
Name
Owned For
Owner Type
Purchase Details
Closed on
Aug 3, 2010
Sold by
Craig 5 Llc
Bought by
Todorovich Fanny
Current Estimated Value
Home Financials for this Owner
Home Financials are based on the most recent Mortgage that was taken out on this home.
Original Mortgage
$120,378
Outstanding Balance
$83,350
Interest Rate
5.5%
Mortgage Type
FHA
Estimated Equity
$99,669
Purchase Details
Closed on
Apr 16, 2009
Sold by
Federal Deposit Insurance Corporation
Bought by
Jpmorgan Chase Bank National Association
Purchase Details
Closed on
Apr 1, 2009
Sold by
Jp Morgan Chase Bank National Associatio
Bought by
Craig 5 Llc
Purchase Details
Closed on
Sep 3, 2008
Sold by
St Hill James A
Bought by
Washington Mutual Bank
Purchase Details
Closed on
Jul 30, 1999
Sold by
Fischer Charlotte Gray
Bought by
Sthill James and Sthill Edna
Create a Home Valuation Report for This Property
The Home Valuation Report is an in-depth analysis detailing your home's value as well as a comparison with similar homes in the area
Home Values in the Area
Average Home Value in this Area
Purchase History
| Date | Buyer | Sale Price | Title Company |
|---|---|---|---|
| Todorovich Fanny | $122,000 | First American Title Ins Co | |
| Jpmorgan Chase Bank National Association | -- | None Available | |
| Craig 5 Llc | $40,000 | Chicago Title Servicelink Di | |
| Washington Mutual Bank | -- | None Available | |
| Sthill James | $39,500 | Fidelity National Title Ins |
Source: Public Records
Mortgage History
| Date | Status | Borrower | Loan Amount |
|---|---|---|---|
| Open | Todorovich Fanny | $120,378 |
Source: Public Records
Tax History Compared to Growth
Tax History
| Year | Tax Paid | Tax Assessment Tax Assessment Total Assessment is a certain percentage of the fair market value that is determined by local assessors to be the total taxable value of land and additions on the property. | Land | Improvement |
|---|---|---|---|---|
| 2025 | $3,807 | $72,400 | $21,400 | $51,000 |
| 2024 | $3,807 | $72,400 | $21,400 | $51,000 |
| 2023 | $3,574 | $72,400 | $21,400 | $51,000 |
| 2022 | $3,574 | $72,400 | $21,400 | $51,000 |
| 2021 | $3,471 | $72,400 | $21,400 | $51,000 |
| 2020 | $3,456 | $72,400 | $21,400 | $51,000 |
| 2019 | $3,126 | $64,800 | $20,700 | $44,100 |
| 2018 | $3,028 | $64,800 | $20,700 | $44,100 |
| 2017 | $2,857 | $64,800 | $20,700 | $44,100 |
| 2016 | $3,044 | $76,200 | $30,700 | $45,500 |
| 2015 | $2,916 | $76,200 | $30,700 | $45,500 |
| 2014 | $2,685 | $76,200 | $30,700 | $45,500 |
Source: Public Records
Map
Nearby Homes
- 75 E Wright St
- 216 Oakland Ave
- 211 Oakland Ave
- 27 Oakland Ave
- 45 E Greenfield Ave
- 333 Oakland Ave
- 10 W Edgewater Ave
- 344 E Edgewater Ave
- 409 Chestnut Ave
- 305 E Black Horse Pike
- 108 E Black Horse Pike
- 24 Frambes Ave
- 119 S Hampden Ct Unit 21
- 39 Frambes Ave
- 201 Genoa Ave
- 135 W Edgewater Ave
- 205 Palermo Ave
- 1104 Clematis Ave
- 1122 Clematis Ave
- 210 E Black Horse Pike
- 115 E Edgewater Ave
- 109 E Edgewater Ave
- 117 E Edgewater Ave
- 119 E Edgewater Ave
- 112 Oakland Ave
- 108 Oakland Ave
- 118 Oakland Ave
- 600 S Edgeley Ave
- 106 Oakland Ave
- 125 E Edgewater Ave
- 116 E Edgewater Ave
- 108 E Edgewater Ave
- 104 Oakland Ave
- 122 Oakland Ave
- 104 E Edgewater Ave
- 120 E Edgewater Ave
- 129 E Edgewater Ave
- 102 E Edgewater Ave
- 41 E Edgewater Ave
- 124 E Edgewater Ave