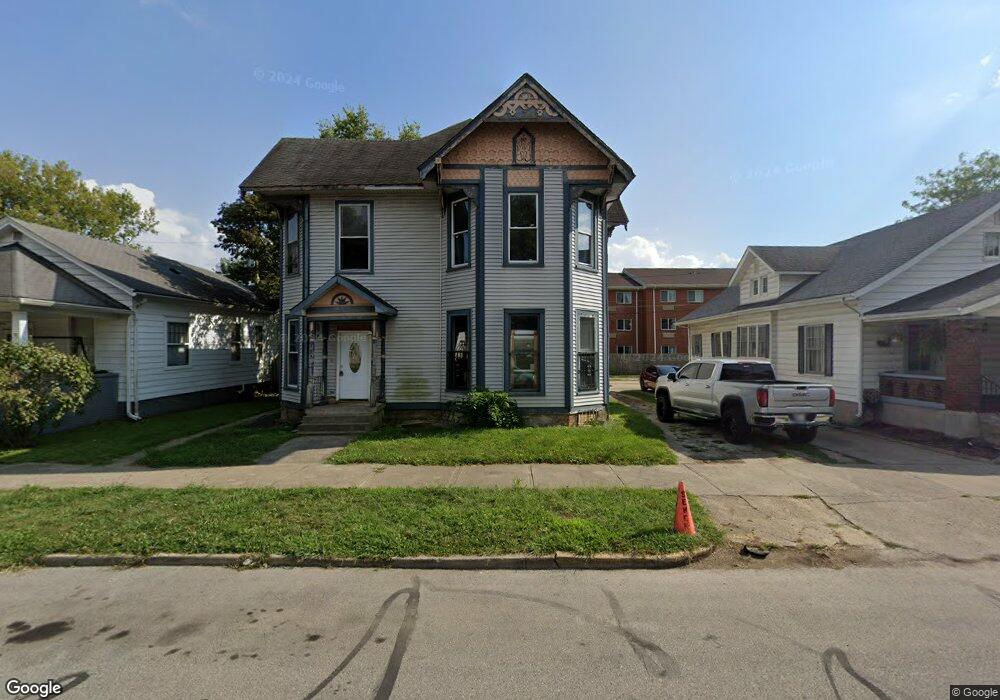
113 E Mechanic St Shelbyville, IN 46176
Estimated Value: $171,000 - $199,607
4
Beds
2
Baths
1,886
Sq Ft
$96/Sq Ft
Est. Value
About This Home
This home is located at 113 E Mechanic St, Shelbyville, IN 46176 and is currently estimated at $181,902, approximately $96 per square foot. 113 E Mechanic St is a home located in Shelby County with nearby schools including Coulston Elementary School, Shelbyville Middle School, and Shelbyville Senior High School.
Ownership History
Date
Name
Owned For
Owner Type
Purchase Details
Closed on
Jun 10, 2022
Sold by
Jeffries Rickey L and Burns Debra K
Bought by
Locust Street Properties Llc
Current Estimated Value
Purchase Details
Closed on
Oct 14, 2021
Sold by
Branson Pamela K and Henry Paula
Bought by
Jeffries Rickey L and Burns Debra K
Purchase Details
Closed on
Feb 9, 2021
Sold by
Muncy Jo Ann
Bought by
Branson Pamela K and Henry Paula
Purchase Details
Closed on
Jan 2, 2009
Sold by
Fannie Mae
Bought by
Muncy Carl and Muncy Jo Ann
Home Financials for this Owner
Home Financials are based on the most recent Mortgage that was taken out on this home.
Original Mortgage
$29,400
Interest Rate
5.2%
Mortgage Type
Future Advance Clause Open End Mortgage
Purchase Details
Closed on
Oct 3, 2007
Sold by
Barret Bryan A and Barret Michelle A
Bought by
Federal National Mortgage Co
Create a Home Valuation Report for This Property
The Home Valuation Report is an in-depth analysis detailing your home's value as well as a comparison with similar homes in the area
Home Values in the Area
Average Home Value in this Area
Purchase History
| Date | Buyer | Sale Price | Title Company |
|---|---|---|---|
| Locust Street Properties Llc | -- | New Title Company Name | |
| Jeffries Rickey L | -- | None Listed On Document | |
| Branson Pamela K | -- | Title Solutions Plus Corp | |
| Muncy Carl | -- | -- | |
| Federal National Mortgage Co | $115,428 | -- |
Source: Public Records
Mortgage History
| Date | Status | Borrower | Loan Amount |
|---|---|---|---|
| Previous Owner | Muncy Carl | $29,400 |
Source: Public Records
Tax History Compared to Growth
Tax History
| Year | Tax Paid | Tax Assessment Tax Assessment Total Assessment is a certain percentage of the fair market value that is determined by local assessors to be the total taxable value of land and additions on the property. | Land | Improvement |
|---|---|---|---|---|
| 2024 | $1,440 | $72,000 | $6,800 | $65,200 |
| 2023 | $1,444 | $127,600 | $7,000 | $120,600 |
| 2022 | $358 | $48,700 | $6,900 | $41,800 |
| 2021 | $341 | $45,400 | $6,900 | $38,500 |
| 2020 | $880 | $44,000 | $6,900 | $37,100 |
| 2019 | $836 | $41,800 | $6,900 | $34,900 |
| 2018 | $760 | $38,000 | $6,900 | $31,100 |
| 2017 | $734 | $36,700 | $6,900 | $29,800 |
| 2016 | $718 | $35,900 | $6,900 | $29,000 |
| 2014 | $708 | $35,400 | $6,900 | $28,500 |
| 2013 | $708 | $35,400 | $6,900 | $28,500 |
Source: Public Records
Map
Nearby Homes
- 40 E Mechanic St
- 1423 Buttercup Ln Unit Shelbyville
- 264 E Pennsylvania St
- 146 E Broadway St
- 110 N Hamilton St
- 316 E Mechanic St
- 347 E Mechanic St
- 407 Alice St
- 228 W Washington St
- 700 E South St
- 233 W Jackson St
- 232 W Broadway St
- 201 W Hendricks St
- 616 Main St
- 721 Main St
- 15 N Miller St
- 410 Howard St
- 217 Howard St
- 316 W Broadway St
- 325 East Dr
- 119 E Mechanic St
- 109 E Mechanic St
- 123 E Mechanic St
- 123 E Mechanic St
- 123 E Mechanic St
- 114 E Mechanic St
- 123-125 E Mechanic St
- 105 E Mechanic St
- 104 E Mechanic St
- 122 E Mechanic St
- 120 E Mechanic St
- 110 E Mechanic St
- 131 E Mechanic St
- 102 E Franklin St
- 102 E Franklin St
- 59 E Mechanic St Unit 61
- 212 N Pike St
- 120 E Franklin St
- 113 N Pike St
- 132.5 E Mechanic St