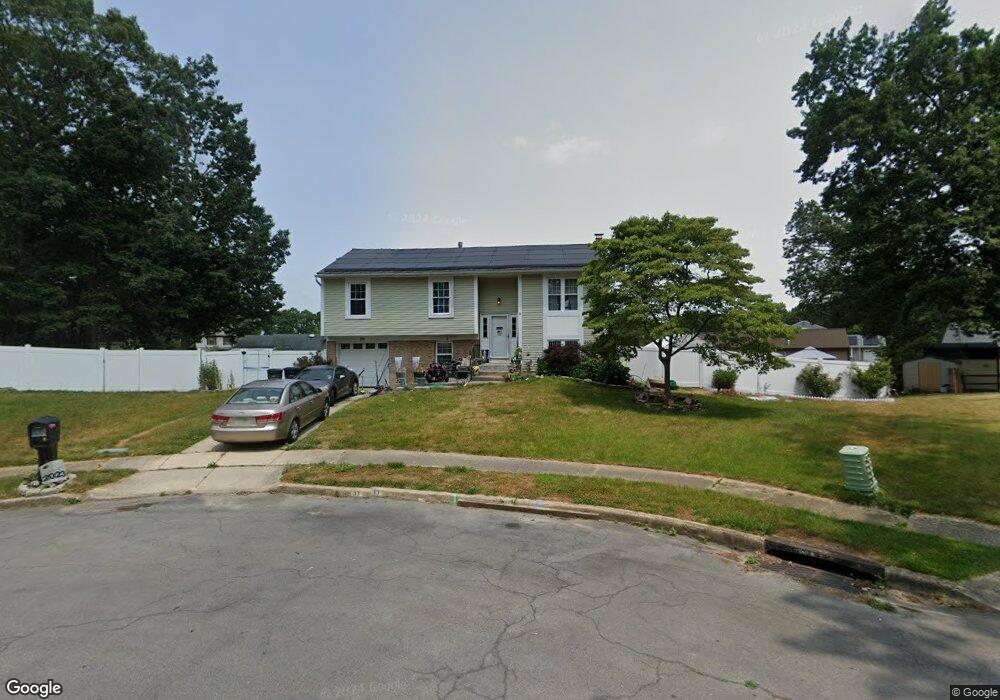
113 Easton Ct Williamstown, NJ 08094
Estimated Value: $351,000 - $419,000
4
Beds
2
Baths
1,830
Sq Ft
$213/Sq Ft
Est. Value
About This Home
This home is located at 113 Easton Ct, Williamstown, NJ 08094 and is currently estimated at $389,312, approximately $212 per square foot. 113 Easton Ct is a home located in Gloucester County with nearby schools including Williamstown High School, St. Mary School, and Finest of the Wheat Christian.
Ownership History
Date
Name
Owned For
Owner Type
Purchase Details
Closed on
Feb 3, 2011
Sold by
Didino Benjamin J
Bought by
Warnick John M and Warnick Eve
Current Estimated Value
Home Financials for this Owner
Home Financials are based on the most recent Mortgage that was taken out on this home.
Original Mortgage
$204,676
Outstanding Balance
$140,321
Interest Rate
4.82%
Mortgage Type
FHA
Estimated Equity
$248,991
Purchase Details
Closed on
Jan 12, 2011
Sold by
Didino Tonya
Bought by
Didino Benjamin J
Home Financials for this Owner
Home Financials are based on the most recent Mortgage that was taken out on this home.
Original Mortgage
$204,676
Outstanding Balance
$140,321
Interest Rate
4.82%
Mortgage Type
FHA
Estimated Equity
$248,991
Purchase Details
Closed on
Jul 30, 2003
Sold by
Wiseley Ralph C and Wiseley Susan M
Bought by
Didino Benjamin J
Home Financials for this Owner
Home Financials are based on the most recent Mortgage that was taken out on this home.
Original Mortgage
$132,000
Interest Rate
5.28%
Mortgage Type
Purchase Money Mortgage
Create a Home Valuation Report for This Property
The Home Valuation Report is an in-depth analysis detailing your home's value as well as a comparison with similar homes in the area
Home Values in the Area
Average Home Value in this Area
Purchase History
| Date | Buyer | Sale Price | Title Company |
|---|---|---|---|
| Warnick John M | $211,871 | None Available | |
| Didino Benjamin J | -- | None Available | |
| Didino Benjamin J | $165,000 | Congress |
Source: Public Records
Mortgage History
| Date | Status | Borrower | Loan Amount |
|---|---|---|---|
| Open | Warnick John M | $204,676 | |
| Previous Owner | Didino Benjamin J | $132,000 |
Source: Public Records
Tax History Compared to Growth
Tax History
| Year | Tax Paid | Tax Assessment Tax Assessment Total Assessment is a certain percentage of the fair market value that is determined by local assessors to be the total taxable value of land and additions on the property. | Land | Improvement |
|---|---|---|---|---|
| 2025 | $6,866 | $187,500 | $42,500 | $145,000 |
| 2024 | $6,816 | $187,500 | $42,500 | $145,000 |
| 2023 | $6,816 | $187,500 | $42,500 | $145,000 |
| 2022 | $6,784 | $187,500 | $42,500 | $145,000 |
| 2021 | $6,264 | $187,500 | $42,500 | $145,000 |
| 2020 | $6,819 | $187,500 | $42,500 | $145,000 |
| 2019 | $6,778 | $187,500 | $42,500 | $145,000 |
| 2018 | $6,668 | $187,500 | $42,500 | $145,000 |
| 2017 | $6,411 | $181,000 | $56,200 | $124,800 |
| 2016 | $6,330 | $181,000 | $56,200 | $124,800 |
| 2015 | $6,149 | $181,000 | $56,200 | $124,800 |
| 2014 | $5,969 | $181,000 | $56,200 | $124,800 |
Source: Public Records
Map
Nearby Homes
- 42 Avery Dr
- 956 N Beecham Rd
- 900 Greenwich Ct
- 805 Galleria Dr
- 1602 Pin Oak Rd
- 1605 Pin Oak Rd
- 1601 White Oak Ln
- 444 Longfellow Dr
- 714 Chadsford Rd
- 120 Hemlock Dr
- 37 Carroll Ave
- 1406 Exposition Dr
- 103 Raphael Ct Unit 103
- 0 Blue Bell Rd Unit NJGL2064620
- 0 Blue Bell Rd Unit 24132699
- 112 Hemlock Dr
- 943 Sykesville Rd
- 505 Matisse Way Unit 505
- 520 S Main St
- 232 Chestnut St
- 112 Easton Ct
- 109 Easton Ct
- 1184 S Beecham Rd
- 1180 S Beecham Rd
- 1188 S Beecham Rd
- 1176 S Beecham Rd
- 1192 S Beecham Rd
- 108 Easton Ct
- 1172 S Beecham Rd
- 105 Easton Ct
- 104 Easton Ct
- 1168 S Beecham Rd
- 1196 S Beecham Rd
- 101 Easton Ct
- 100 Easton Ct
- 1189 S Beecham Rd
- 1193 S Beecham Rd
- 1197 S Beecham Rd
- 1185 S Beecham Rd
- 1201 S Beecham Rd