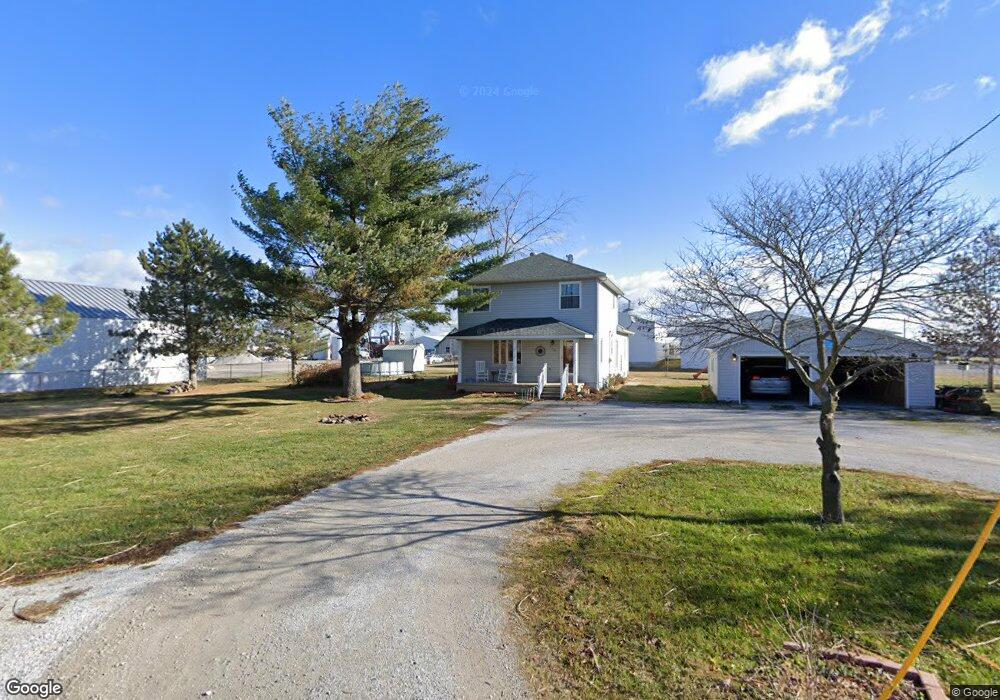
113 Elm St Hoffman, IL 62250
Estimated Value: $177,000 - $186,000
5
Beds
3
Baths
2,080
Sq Ft
$88/Sq Ft
Est. Value
About This Home
This home is located at 113 Elm St, Hoffman, IL 62250 and is currently estimated at $182,091, approximately $87 per square foot. 113 Elm St is a home located in Clinton County with nearby schools including Carlyle Elementary School, Carlyle Junior High School, and Carlyle High School.
Ownership History
Date
Name
Owned For
Owner Type
Purchase Details
Closed on
May 11, 2021
Sold by
Hartman Amanda
Bought by
Hartman Gary L and Hartman Melissa
Current Estimated Value
Home Financials for this Owner
Home Financials are based on the most recent Mortgage that was taken out on this home.
Original Mortgage
$96,000
Outstanding Balance
$87,000
Interest Rate
3.1%
Mortgage Type
New Conventional
Estimated Equity
$95,091
Purchase Details
Closed on
Dec 18, 2012
Sold by
Luebbers Michael J and Luebbers Shirlene J
Bought by
Hartman Gary L and Hartman Amanda J
Home Financials for this Owner
Home Financials are based on the most recent Mortgage that was taken out on this home.
Original Mortgage
$117,887
Interest Rate
3.38%
Mortgage Type
New Conventional
Purchase Details
Closed on
Feb 16, 2005
Sold by
Luebbers Michael J and Boehne Shirlene J
Bought by
Luebbers Michael J and Luebbers Shirlene J
Create a Home Valuation Report for This Property
The Home Valuation Report is an in-depth analysis detailing your home's value as well as a comparison with similar homes in the area
Purchase History
| Date | Buyer | Sale Price | Title Company |
|---|---|---|---|
| Hartman Gary L | -- | None Available | |
| Hartman Gary L | $116,000 | None Available | |
| Luebbers Michael J | -- | None Available |
Source: Public Records
Mortgage History
| Date | Status | Borrower | Loan Amount |
|---|---|---|---|
| Open | Hartman Gary L | $96,000 | |
| Closed | Hartman Gary L | $117,887 |
Source: Public Records
Tax History
| Year | Tax Paid | Tax Assessment Tax Assessment Total Assessment is a certain percentage of the fair market value that is determined by local assessors to be the total taxable value of land and additions on the property. | Land | Improvement |
|---|---|---|---|---|
| 2024 | $2,988 | $53,050 | $4,730 | $48,320 |
| 2023 | $2,988 | $50,520 | $4,500 | $46,020 |
| 2022 | $2,913 | $50,030 | $4,680 | $45,350 |
| 2021 | $2,839 | $48,110 | $4,500 | $43,610 |
| 2020 | $2,858 | $48,110 | $4,500 | $43,610 |
| 2019 | $2,821 | $48,110 | $4,500 | $43,610 |
| 2018 | $2,474 | $40,650 | $5,630 | $35,020 |
| 2017 | $2,496 | $40,650 | $5,630 | $35,020 |
| 2016 | $2,486 | $40,650 | $5,630 | $35,020 |
| 2015 | $2,619 | $40,650 | $5,630 | $35,020 |
| 2013 | $2,619 | $42,530 | $5,630 | $36,900 |
Source: Public Records
Map
Nearby Homes
- 113 N Oak St
- 109 S Broadway
- 7302 Hoffman Rd
- 19128 County Highway 24
- 22000 East Rd
- 530 Joseph St
- 220 Bruce Ct
- 1020 W Mccord St
- 411 Sunset Dr
- 527 Sunset Dr
- 510 West Haven
- 504 Westhaven Dr
- 510 Westhaven Dr
- 36 Buena Vista Terrace Unit P.O.
- 405 Easthaven Dr
- 101 Marilyn Ave
- 620 N Main St
- 200 N Brooks Ave
- 523 W 4th St
- 404 N Beech St