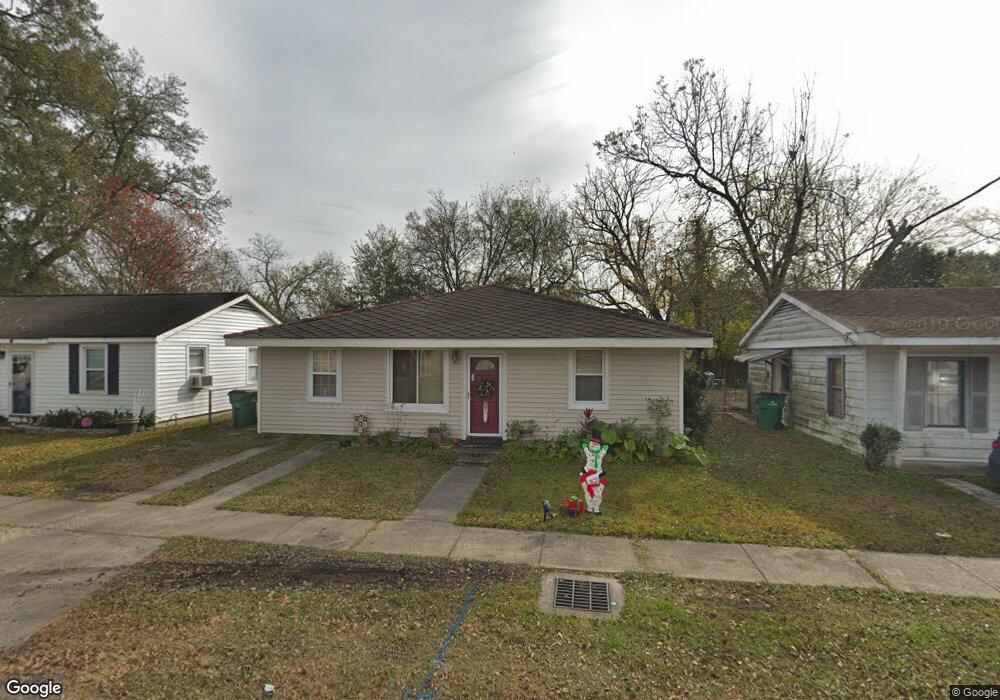
113 Gassen St Luling, LA 70070
Estimated Value: $187,000 - $255,000
3
Beds
1
Bath
1,551
Sq Ft
$135/Sq Ft
Est. Value
About This Home
This home is located at 113 Gassen St, Luling, LA 70070 and is currently estimated at $209,573, approximately $135 per square foot. 113 Gassen St is a home located in St. Charles Parish with nearby schools including Luling Elementary School, R.K. Smith Middle School, and Hahnville High School.
Ownership History
Date
Name
Owned For
Owner Type
Purchase Details
Closed on
Mar 29, 2022
Sold by
Ann Harper Lea
Bought by
Hill Marcus
Current Estimated Value
Home Financials for this Owner
Home Financials are based on the most recent Mortgage that was taken out on this home.
Original Mortgage
$186,868
Outstanding Balance
$174,378
Interest Rate
4.42%
Mortgage Type
New Conventional
Estimated Equity
$35,195
Purchase Details
Closed on
May 6, 2011
Sold by
Soderstrom Garrett L
Bought by
Delatte Lee Ann Harper
Home Financials for this Owner
Home Financials are based on the most recent Mortgage that was taken out on this home.
Original Mortgage
$145,077
Interest Rate
4.91%
Mortgage Type
New Conventional
Purchase Details
Closed on
May 26, 2006
Sold by
Landry Antonette Ringe
Bought by
Soderstrom Garrett L
Home Financials for this Owner
Home Financials are based on the most recent Mortgage that was taken out on this home.
Original Mortgage
$129,900
Interest Rate
6.56%
Mortgage Type
New Conventional
Create a Home Valuation Report for This Property
The Home Valuation Report is an in-depth analysis detailing your home's value as well as a comparison with similar homes in the area
Home Values in the Area
Average Home Value in this Area
Purchase History
| Date | Buyer | Sale Price | Title Company |
|---|---|---|---|
| Hill Marcus | -- | Experience Title | |
| Delatte Lee Ann Harper | $140,000 | Crescent Title Llc | |
| Soderstrom Garrett L | $129,900 | Choice Title |
Source: Public Records
Mortgage History
| Date | Status | Borrower | Loan Amount |
|---|---|---|---|
| Open | Hill Marcus | $186,868 | |
| Previous Owner | Delatte Lee Ann Harper | $145,077 | |
| Previous Owner | Soderstrom Garrett L | $129,900 |
Source: Public Records
Tax History
| Year | Tax Paid | Tax Assessment Tax Assessment Total Assessment is a certain percentage of the fair market value that is determined by local assessors to be the total taxable value of land and additions on the property. | Land | Improvement |
|---|---|---|---|---|
| 2025 | $803 | $15,440 | $2,140 | $13,300 |
| 2024 | $803 | $15,440 | $2,140 | $13,300 |
| 2023 | $815 | $11,446 | $1,960 | $9,486 |
| 2022 | $1,339 | $11,446 | $1,960 | $9,486 |
| 2021 | $1,215 | $10,301 | $1,764 | $8,537 |
| 2020 | $1,352 | $11,446 | $1,960 | $9,486 |
| 2019 | $1,494 | $12,600 | $1,266 | $11,334 |
| 2018 | $1,483 | $12,600 | $1,266 | $11,334 |
| 2017 | $1,481 | $12,600 | $1,266 | $11,334 |
| 2016 | $1,487 | $12,600 | $1,266 | $11,334 |
| 2015 | $600 | $12,600 | $1,266 | $11,334 |
| 2014 | $578 | $12,600 | $1,266 | $11,334 |
| 2013 | $580 | $12,600 | $1,266 | $11,334 |
Source: Public Records
Map
Nearby Homes
- 131 Antoine Ln
- 826 Mongrue St
- 208 Ellington Ave
- 412 Milling Ave
- 514 Milling Ave
- 313 Post Dr
- 708 Sugarhouse Rd
- LOTS J2A 3-4-5-&6 E Campus Dr
- LOTS J2A 3-4-5- E Campus Dr
- LOT J2A-5&6 E Campus Dr
- 1008 Gassen St
- 109 Lac Cypriere Dr
- 12625 River Rd
- 112 Allie Ln
- 204 Lac Segnette Dr
- 1214 Gassen St
- 1216 Gassen St
- 205 Cove Pointe Dr
- 1 W Alpha Dr
Your Personal Tour Guide
Ask me questions while you tour the home.