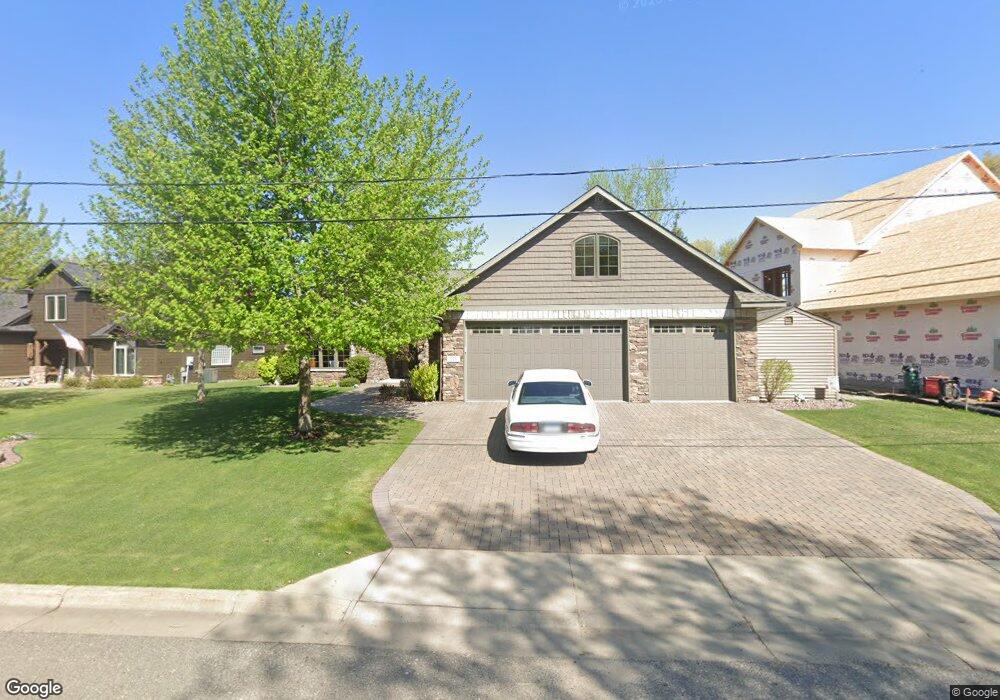
113 Hill St Big Lake, MN 55309
Estimated Value: $586,000 - $806,927
3
Beds
4
Baths
2,051
Sq Ft
$347/Sq Ft
Est. Value
About This Home
This home is located at 113 Hill St, Big Lake, MN 55309 and is currently estimated at $712,309, approximately $347 per square foot. 113 Hill St is a home located in Sherburne County with nearby schools including Liberty Elementary School, Independence Elementary School, and Big Lake Middle School.
Ownership History
Date
Name
Owned For
Owner Type
Purchase Details
Closed on
Jun 25, 2018
Sold by
Kurtz Diann Mae and Boser Diann Mae
Bought by
Kurtz Diann Mae and Diann Mae Kurtz Revocable Livi
Current Estimated Value
Purchase Details
Closed on
Jun 19, 2018
Sold by
Boser Blaise Herman
Bought by
Kurtz Diann Mae and Boser Diann Mae
Purchase Details
Closed on
Jan 29, 2018
Sold by
Kurtz Diann Mae and Boser Diann Mae
Bought by
Kurtz Diann Mae and Diann Mae Kurtz Revocable Trus
Purchase Details
Closed on
Oct 29, 2008
Sold by
Quality Checked Construction Inc
Bought by
Boser Blaise and Boser Diann
Purchase Details
Closed on
Oct 4, 2005
Sold by
Kosmides George I
Bought by
Quality Checked Construction Inc
Home Financials for this Owner
Home Financials are based on the most recent Mortgage that was taken out on this home.
Original Mortgage
$207,500
Interest Rate
5.82%
Mortgage Type
Purchase Money Mortgage
Create a Home Valuation Report for This Property
The Home Valuation Report is an in-depth analysis detailing your home's value as well as a comparison with similar homes in the area
Home Values in the Area
Average Home Value in this Area
Purchase History
| Date | Buyer | Sale Price | Title Company |
|---|---|---|---|
| Kurtz Diann Mae | -- | None Available | |
| Kurtz Diann Mae | -- | None Available | |
| Kurtz Diann Mae | -- | None Available | |
| Kurtz Diann Mae | -- | -- | |
| Boser Blaise | $200,000 | -- | |
| Quality Checked Construction Inc | $215,000 | -- | |
| Quality Checked Constr Inc | $215,000 | -- |
Source: Public Records
Mortgage History
| Date | Status | Borrower | Loan Amount |
|---|---|---|---|
| Previous Owner | Quality Checked Constr Inc | $207,500 |
Source: Public Records
Tax History Compared to Growth
Tax History
| Year | Tax Paid | Tax Assessment Tax Assessment Total Assessment is a certain percentage of the fair market value that is determined by local assessors to be the total taxable value of land and additions on the property. | Land | Improvement |
|---|---|---|---|---|
| 2025 | $9,502 | $715,000 | $284,100 | $430,900 |
| 2024 | $9,596 | $715,000 | $284,100 | $430,900 |
| 2023 | $8,614 | $737,700 | $300,800 | $436,900 |
| 2022 | $7,358 | $648,300 | $237,000 | $411,300 |
| 2020 | $7,508 | $476,200 | $156,100 | $320,100 |
| 2019 | $7,248 | $473,500 | $152,800 | $320,700 |
| 2018 | $7,298 | $449,300 | $146,000 | $303,300 |
| 2017 | $7,032 | $432,500 | $146,000 | $286,500 |
| 2016 | $6,750 | $402,000 | $131,600 | $270,400 |
| 2015 | $6,852 | $387,000 | $130,900 | $256,100 |
| 2014 | $6,192 | $412,500 | $162,100 | $250,400 |
| 2013 | -- | $353,400 | $138,400 | $215,000 |
Source: Public Records
Map
Nearby Homes
- 1280 Hill St
- 5017 Edinburgh Way
- 18012 Walnut Cir
- 18050 Walnut Cir
- 18052 Walnut Cir
- 18041 Walnut Cir
- 18043 Walnut Cir
- 18059 Walnut Cir
- 18585 Arctic Ave
- 1641 Kenabec St
- 585 Glenwood Ave
- 5385 Edinburgh Way
- 4327 Sterling Dr
- 591 Glenwood Ave
- 679 Lakeshore Dr
- 1106 Kilbirnie Rd
- 5008 Bluff Rd
- TBD Manitou St
- 491 Highland Ave
- 1075 Kilbirnie Rd