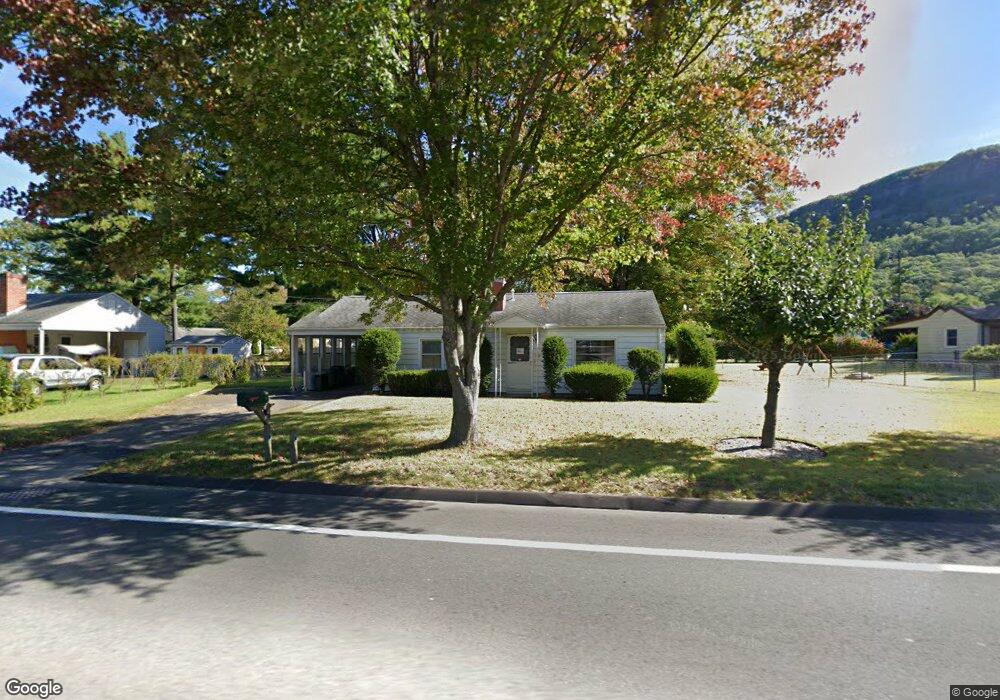
113 Holyoke St Easthampton, MA 01027
Estimated Value: $299,000 - $322,000
3
Beds
2
Baths
864
Sq Ft
$358/Sq Ft
Est. Value
About This Home
This home is located at 113 Holyoke St, Easthampton, MA 01027 and is currently estimated at $309,184, approximately $357 per square foot. 113 Holyoke St is a home located in Hampshire County with nearby schools including Easthampton High School, Tri-County Schools, and New England Adolescent Research Institute.
Ownership History
Date
Name
Owned For
Owner Type
Purchase Details
Closed on
Aug 21, 2015
Sold by
Bealer Jennifer D
Bought by
Wolfsong Kim
Current Estimated Value
Home Financials for this Owner
Home Financials are based on the most recent Mortgage that was taken out on this home.
Original Mortgage
$132,000
Outstanding Balance
$103,958
Interest Rate
4.07%
Mortgage Type
New Conventional
Estimated Equity
$205,226
Purchase Details
Closed on
Jun 29, 2006
Sold by
Krumpholz Ret and Krumpholz Carol Ann
Bought by
Bealer Jennifer D and Wolfsong Kim
Home Financials for this Owner
Home Financials are based on the most recent Mortgage that was taken out on this home.
Original Mortgage
$116,600
Interest Rate
6.58%
Mortgage Type
Purchase Money Mortgage
Purchase Details
Closed on
Jun 22, 2004
Sold by
Krumpholz Carol Ann
Bought by
Krumpholz Ret and Krumpholz Carol Ann
Create a Home Valuation Report for This Property
The Home Valuation Report is an in-depth analysis detailing your home's value as well as a comparison with similar homes in the area
Home Values in the Area
Average Home Value in this Area
Purchase History
We collect this data history from publicly available records. To have your information removed, we recommend requesting removal directly through your county’s website.
| Date | Buyer | Sale Price | Title Company |
|---|---|---|---|
| Wolfsong Kim | -- | -- | |
| Bealer Jennifer D | $167,000 | -- | |
| Krumpholz Ret | -- | -- |
Source: Public Records
Mortgage History
We collect this data history from publicly available records. To have your information removed, we recommend requesting removal directly through your county’s website.
| Date | Status | Borrower | Loan Amount |
|---|---|---|---|
| Open | Wolfsong Kim | $132,000 | |
| Previous Owner | Bealer Jennifer D | $116,600 |
Source: Public Records
Tax History
| Year | Tax Paid | Tax Assessment Tax Assessment Total Assessment is a certain percentage of the fair market value that is determined by local assessors to be the total taxable value of land and additions on the property. | Land | Improvement |
|---|---|---|---|---|
| 2025 | $3,618 | $264,700 | $107,900 | $156,800 |
| 2024 | $3,490 | $257,400 | $104,700 | $152,700 |
| 2023 | $2,762 | $188,500 | $82,500 | $106,000 |
| 2022 | $3,116 | $188,500 | $82,500 | $106,000 |
| 2021 | $3,401 | $193,900 | $82,500 | $111,400 |
| 2020 | $3,348 | $188,500 | $82,500 | $106,000 |
| 2019 | $1,676 | $182,000 | $82,500 | $99,500 |
| 2018 | $2,698 | $168,600 | $77,800 | $90,800 |
| 2017 | $2,633 | $162,400 | $74,800 | $87,600 |
| 2016 | $2,532 | $162,400 | $74,800 | $87,600 |
| 2015 | $2,460 | $162,400 | $74,800 | $87,600 |
Source: Public Records
Map
Nearby Homes
- 123 Holyoke St
- 52-54 Holyoke St
- 27 Holyoke St
- 26 Mount Tom Ave
- 17 Olympia St
- 85 Garfield Ave
- 17 Adams St
- 36 & 36R Holly Cir
- 105 Plain St
- 74 Parsons St
- 64-66 Pleasant St
- M143 &152 Glendale St
- 20 Meadowbrook Dr
- 50 Phelps St
- 138 West St
- 27 Mount Tom Ave
- 19 Beyer Dr
- Lot 1 Edgewater Ln
- 7 Western View Rd
- 39 Pleasant St
Your Personal Tour Guide
Ask me questions while you tour the home.