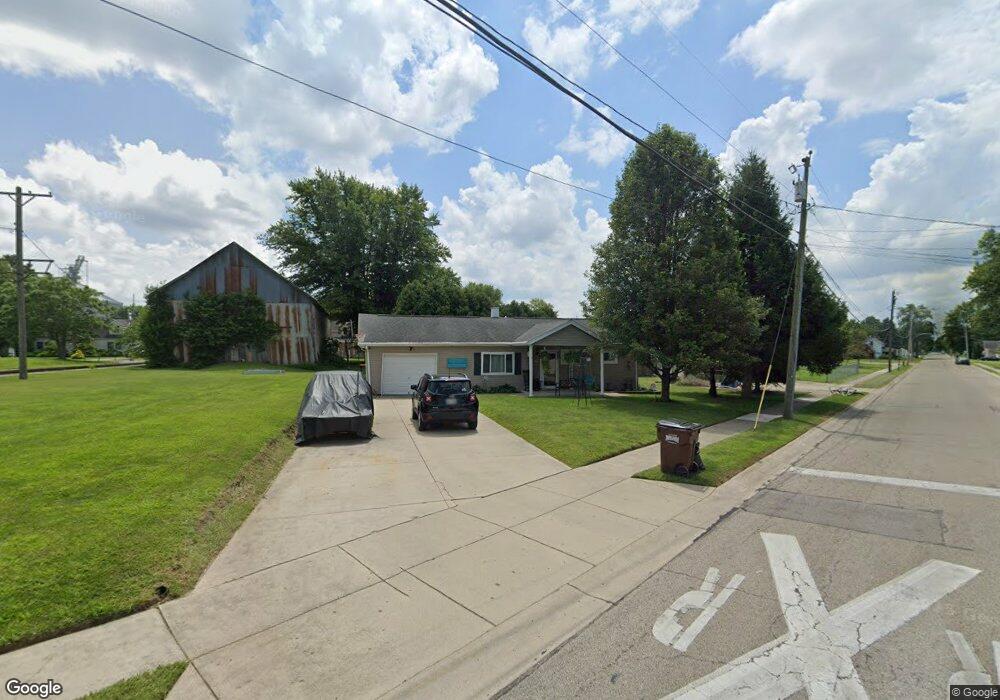
113 Jamestown Rd South Charleston, OH 45368
Estimated Value: $178,000 - $224,000
4
Beds
1
Bath
1,200
Sq Ft
$166/Sq Ft
Est. Value
About This Home
This home is located at 113 Jamestown Rd, South Charleston, OH 45368 and is currently estimated at $198,698, approximately $165 per square foot. 113 Jamestown Rd is a home located in Clark County with nearby schools including Miami View Elementary School and Southeastern Senior High School.
Ownership History
Date
Name
Owned For
Owner Type
Purchase Details
Closed on
Nov 6, 2020
Sold by
Gaddis John E and Gaddis Angela J
Bought by
Baker Zachary S
Current Estimated Value
Home Financials for this Owner
Home Financials are based on the most recent Mortgage that was taken out on this home.
Original Mortgage
$137,373
Outstanding Balance
$122,242
Interest Rate
2.8%
Mortgage Type
New Conventional
Estimated Equity
$76,456
Purchase Details
Closed on
Dec 27, 2005
Sold by
Gaddis Angela J
Bought by
Gaddis John E and Gaddis Angela J
Home Financials for this Owner
Home Financials are based on the most recent Mortgage that was taken out on this home.
Original Mortgage
$54,600
Interest Rate
9.15%
Mortgage Type
Stand Alone Refi Refinance Of Original Loan
Purchase Details
Closed on
Jul 29, 2005
Sold by
Blankenship Shawn W
Bought by
Gaddis Angela J
Purchase Details
Closed on
May 27, 2005
Sold by
Estate Of Ronald W Blankenship
Bought by
Gaddis Angela J and Blankenship Shawn W
Create a Home Valuation Report for This Property
The Home Valuation Report is an in-depth analysis detailing your home's value as well as a comparison with similar homes in the area
Home Values in the Area
Average Home Value in this Area
Purchase History
| Date | Buyer | Sale Price | Title Company |
|---|---|---|---|
| Baker Zachary S | $136,000 | Midland Title West Llc | |
| Gaddis John E | -- | None Available | |
| Gaddis Angela J | -- | -- | |
| Gaddis Angela J | -- | -- |
Source: Public Records
Mortgage History
| Date | Status | Borrower | Loan Amount |
|---|---|---|---|
| Open | Baker Zachary S | $137,373 | |
| Previous Owner | Gaddis John E | $54,600 |
Source: Public Records
Tax History Compared to Growth
Tax History
| Year | Tax Paid | Tax Assessment Tax Assessment Total Assessment is a certain percentage of the fair market value that is determined by local assessors to be the total taxable value of land and additions on the property. | Land | Improvement |
|---|---|---|---|---|
| 2024 | $1,309 | $31,280 | $5,120 | $26,160 |
| 2023 | $1,309 | $31,280 | $5,120 | $26,160 |
| 2022 | $1,251 | $31,280 | $5,120 | $26,160 |
| 2021 | $1,065 | $23,880 | $3,910 | $19,970 |
| 2020 | $1,068 | $23,880 | $3,910 | $19,970 |
| 2019 | $1,050 | $23,880 | $3,910 | $19,970 |
| 2018 | $947 | $22,010 | $3,910 | $18,100 |
| 2017 | $944 | $22,008 | $3,906 | $18,102 |
| 2016 | $934 | $22,008 | $3,906 | $18,102 |
| 2015 | $921 | $21,133 | $3,906 | $17,227 |
| 2014 | $921 | $21,133 | $3,906 | $17,227 |
| 2013 | $922 | $21,133 | $3,906 | $17,227 |
Source: Public Records
Map
Nearby Homes
- 107 Jamestown Rd Unit 107
- 208 Willow St
- 210 Willow St
- 108 Jamestown Rd
- 104 Jamestown Rd
- 144 Willow St
- 127 Jamestown Rd
- 207 Willow St
- 203 Willow St
- 128 Jamestown Rd
- 211 Willow St
- 138 Willow St
- 145 Willow St
- 99 Jamestown Rd
- 50 Jamestown Rd
- 141 Willow St
- 223 Willow St
- 134 Jamestown Rd
- 225 Willow St
- 134 Willow St