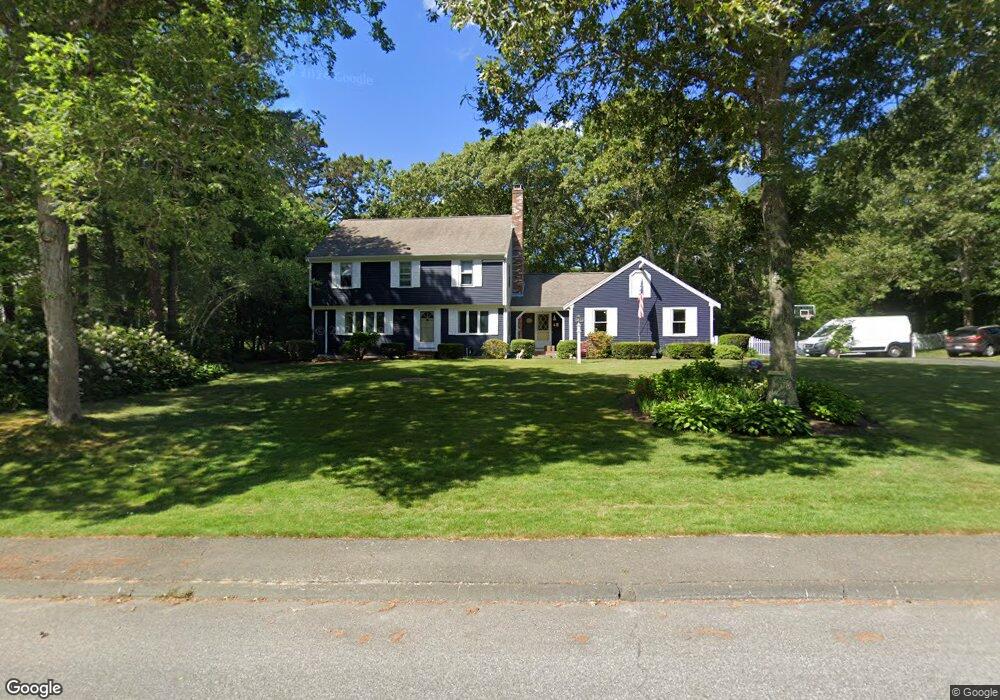
113 Kettle Hole Rd West Barnstable, MA 02668
West Barnstable NeighborhoodEstimated Value: $725,000 - $926,000
4
Beds
3
Baths
2,264
Sq Ft
$371/Sq Ft
Est. Value
About This Home
This home is located at 113 Kettle Hole Rd, West Barnstable, MA 02668 and is currently estimated at $840,716, approximately $371 per square foot. 113 Kettle Hole Rd is a home located in Barnstable County with nearby schools including West Barnstable Elementary School, Barnstable United Elementary School, and Barnstable Intermediate School.
Ownership History
Date
Name
Owned For
Owner Type
Purchase Details
Closed on
Mar 24, 2025
Sold by
Sylvester Allen T
Bought by
Sylvester Ft and Sylvester
Current Estimated Value
Purchase Details
Closed on
Sep 20, 2024
Sold by
Sylvester Allen T and Sylvester Coralyn
Bought by
Sylvester Allen T
Purchase Details
Closed on
Dec 17, 2010
Sold by
Obrien Kenneth T and Obrien Irene
Bought by
Sylvester Allen T and Sylvester Coralyn
Home Financials for this Owner
Home Financials are based on the most recent Mortgage that was taken out on this home.
Original Mortgage
$400,000
Interest Rate
4.23%
Mortgage Type
Purchase Money Mortgage
Purchase Details
Closed on
Aug 26, 1993
Sold by
Obrien Kenneth T and Obrien Irene
Bought by
Travers Frank and Travers Belmira
Create a Home Valuation Report for This Property
The Home Valuation Report is an in-depth analysis detailing your home's value as well as a comparison with similar homes in the area
Home Values in the Area
Average Home Value in this Area
Purchase History
| Date | Buyer | Sale Price | Title Company |
|---|---|---|---|
| Sylvester Ft | -- | None Available | |
| Sylvester Ft | -- | None Available | |
| Sylvester Allen T | -- | Equity National Title | |
| Sylvester Allen T | -- | Equity National Title | |
| Sylvester Allen T | -- | Equity National Title | |
| Sylvester Allen T | $425,000 | -- | |
| Travers Frank | $36,300 | -- | |
| Sylvester Allen T | $425,000 | -- |
Source: Public Records
Mortgage History
| Date | Status | Borrower | Loan Amount |
|---|---|---|---|
| Previous Owner | Sylvester Allen T | $400,000 | |
| Previous Owner | Travers Frank | $103,000 | |
| Previous Owner | Travers Frank | $300,000 |
Source: Public Records
Tax History Compared to Growth
Tax History
| Year | Tax Paid | Tax Assessment Tax Assessment Total Assessment is a certain percentage of the fair market value that is determined by local assessors to be the total taxable value of land and additions on the property. | Land | Improvement |
|---|---|---|---|---|
| 2025 | $7,222 | $773,200 | $203,600 | $569,600 |
| 2024 | $6,356 | $740,800 | $203,600 | $537,200 |
| 2023 | $6,069 | $666,200 | $201,300 | $464,900 |
| 2022 | $5,835 | $525,200 | $143,400 | $381,800 |
| 2021 | $5,750 | $490,600 | $143,400 | $347,200 |
| 2020 | $5,334 | $440,100 | $152,600 | $287,500 |
| 2019 | $5,447 | $443,600 | $152,600 | $291,000 |
| 2018 | $5,173 | $417,500 | $167,400 | $250,100 |
| 2017 | $5,020 | $410,100 | $167,400 | $242,700 |
| 2016 | $4,966 | $414,200 | $171,500 | $242,700 |
| 2015 | $4,831 | $403,900 | $160,700 | $243,200 |
Source: Public Records
Map
Nearby Homes
- 97 Kettle Hole Rd
- 131 Kettle Hole Rd
- 114 Kettle Hole Rd
- 132 Kettle Hole Rd
- 98 Kettle Hole Rd
- 81 Kettle Hole Rd
- 148 Kettle Hole Rd
- 145 Kettle Hole Rd
- 82 Kettle Hole Rd
- 65 Kettle Hole Rd
- 572 Cedar St
- 66 Kettle Hole Rd
- 586 Cedar St
- 164 Kettle Hole Rd
- 85 Sheep Meadow Rd
- 558 Cedar St
- 161 Kettle Hole Rd
- 41 Crocker Rd
- 53 Kettle Hole Rd
- 604 Cedar St