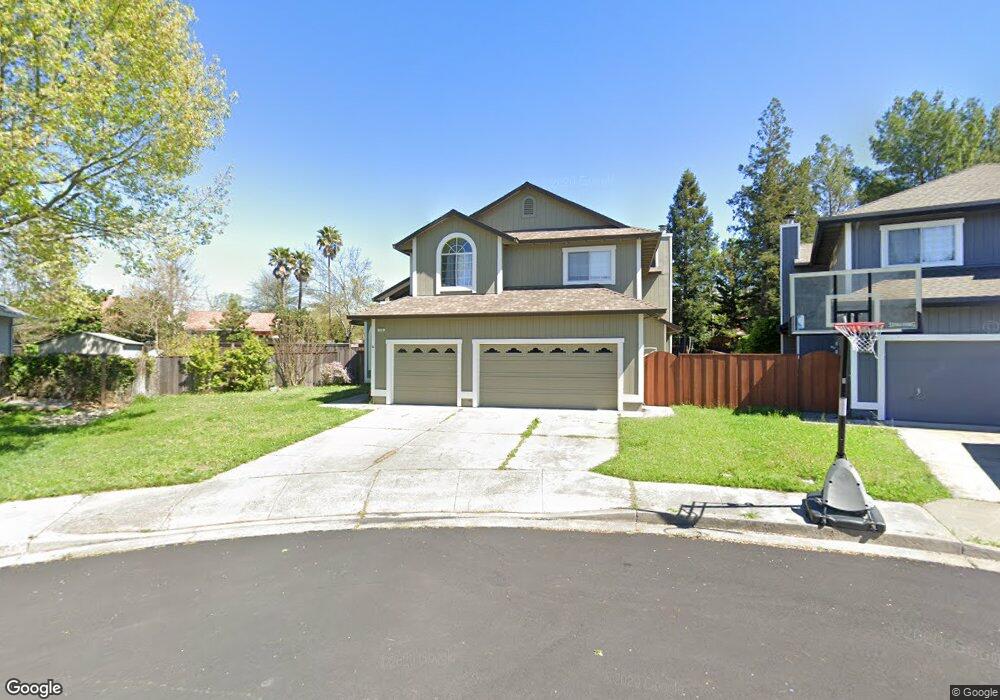
113 Knight Ct Windsor, CA 95492
Estimated Value: $875,614 - $1,062,000
4
Beds
3
Baths
2,202
Sq Ft
$436/Sq Ft
Est. Value
About This Home
This home is located at 113 Knight Ct, Windsor, CA 95492 and is currently estimated at $960,154, approximately $436 per square foot. 113 Knight Ct is a home located in Sonoma County with nearby schools including Mattie Washburn Elementary School, Brooks Elementary School, and Windsor Middle School.
Ownership History
Date
Name
Owned For
Owner Type
Purchase Details
Closed on
May 27, 2015
Sold by
Anzures Andres
Bought by
Holdenried Kevin O and Holdenried Ashley R
Current Estimated Value
Home Financials for this Owner
Home Financials are based on the most recent Mortgage that was taken out on this home.
Original Mortgage
$472,000
Outstanding Balance
$364,136
Interest Rate
3.64%
Mortgage Type
New Conventional
Estimated Equity
$596,018
Purchase Details
Closed on
May 12, 2014
Sold by
Reed Walter A and Reed Lori L
Bought by
Anzures Andres
Home Financials for this Owner
Home Financials are based on the most recent Mortgage that was taken out on this home.
Original Mortgage
$412,000
Interest Rate
4.23%
Mortgage Type
New Conventional
Purchase Details
Closed on
Feb 25, 1998
Sold by
Carr Kim
Bought by
Reed Walter A and Reed Lori L
Home Financials for this Owner
Home Financials are based on the most recent Mortgage that was taken out on this home.
Original Mortgage
$185,600
Interest Rate
6.9%
Purchase Details
Closed on
May 20, 1996
Sold by
Carr Lewis N
Bought by
Carr Kim
Create a Home Valuation Report for This Property
The Home Valuation Report is an in-depth analysis detailing your home's value as well as a comparison with similar homes in the area
Home Values in the Area
Average Home Value in this Area
Purchase History
| Date | Buyer | Sale Price | Title Company |
|---|---|---|---|
| Holdenried Kevin O | $590,000 | Fidelity National Title Co | |
| Anzures Andres | $515,000 | Fidelity National Title Co | |
| Reed Walter A | $184,000 | Chicago Title Co | |
| Carr Kim | -- | -- |
Source: Public Records
Mortgage History
| Date | Status | Borrower | Loan Amount |
|---|---|---|---|
| Open | Holdenried Kevin O | $472,000 | |
| Previous Owner | Anzures Andres | $412,000 | |
| Previous Owner | Reed Walter A | $185,600 |
Source: Public Records
Tax History Compared to Growth
Tax History
| Year | Tax Paid | Tax Assessment Tax Assessment Total Assessment is a certain percentage of the fair market value that is determined by local assessors to be the total taxable value of land and additions on the property. | Land | Improvement |
|---|---|---|---|---|
| 2025 | $8,360 | $709,086 | $282,432 | $426,654 |
| 2024 | $8,360 | $695,184 | $276,895 | $418,289 |
| 2023 | $8,360 | $681,554 | $271,466 | $410,088 |
| 2022 | $8,059 | $668,192 | $266,144 | $402,048 |
| 2021 | $7,931 | $655,091 | $260,926 | $394,165 |
| 2020 | $8,110 | $648,375 | $258,251 | $390,124 |
| 2019 | $8,102 | $635,663 | $253,188 | $382,475 |
| 2018 | $7,985 | $623,200 | $248,224 | $374,976 |
| 2017 | $7,094 | $543,963 | $211,248 | $332,715 |
| 2016 | $6,671 | $533,298 | $207,106 | $326,192 |
| 2015 | $6,486 | $525,289 | $203,996 | $321,293 |
| 2014 | $3,842 | $302,185 | $97,687 | $204,498 |
Source: Public Records
Map
Nearby Homes
- 87 Leighann Place
- 770 Miramonte St
- 9793 Montego Ct
- 9636 Lakewood Dr
- 9211 Lakewood Dr
- 9663 Lakewood Dr
- 1109 Jennifer Ln
- 8602 Alden Ln
- 913 Turnberry Ct
- 8501 Shadetree Dr
- 9988 Troon Ct
- 849 Patti Page Ct
- 8743 Franklin St
- 8560 Old Redwood Hwy
- 355 Sugar Maple Ln
- 717 Rosemary Clooney Ct
- 8547 Old Redwood Hwy
- 213 Partridge Ct
- 141 Flametree Cir
- 9376 Jessica Dr
- 109 Knight Ct
- 105 Knight Ct
- 198 Valencia Way
- 116 Knight Ct
- 200 La Quinta Dr
- 194 Valencia Way
- 9479 Victoria Ln
- 112 Knight Ct
- 9475 Victoria Ln
- 108 Knight Ct
- 204 La Quinta Dr
- 190 Valencia Way
- 101 Knight Ct
- 104 Knight Ct
- 186 Valencia Way
- 208 La Quinta Dr
- 9471 Victoria Ln
- 9216 Piccadilly Cir
- 9144 Saint James Place