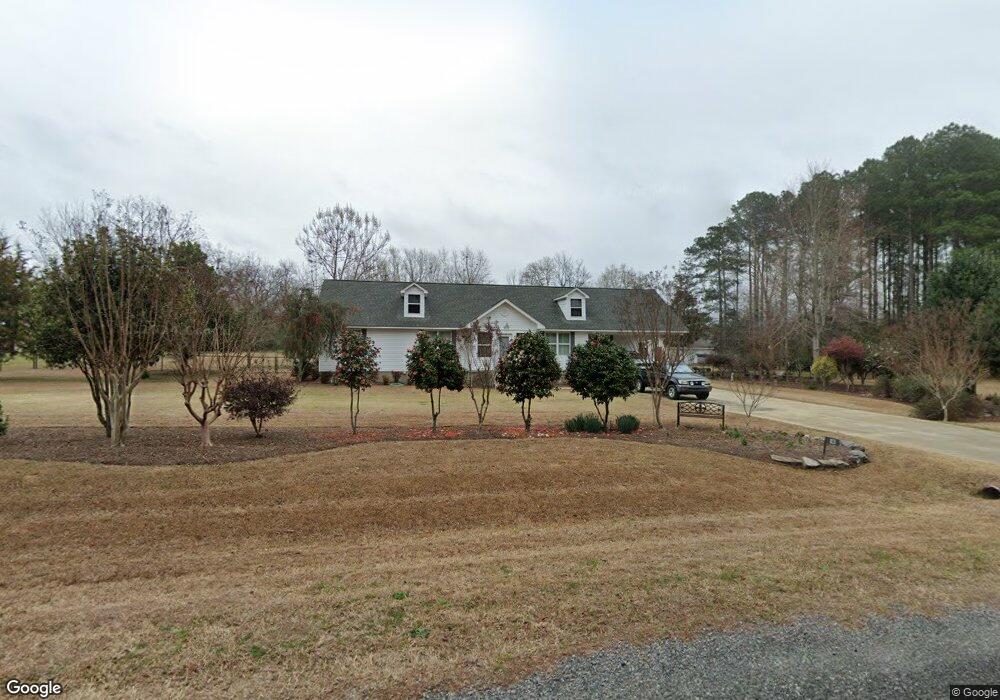
113 Limestone Landing Cochran, GA 31014
Estimated Value: $215,000 - $257,000
3
Beds
2
Baths
1,796
Sq Ft
$128/Sq Ft
Est. Value
About This Home
This home is located at 113 Limestone Landing, Cochran, GA 31014 and is currently estimated at $229,251, approximately $127 per square foot. 113 Limestone Landing is a home located in Bleckley County with nearby schools including Bleckley County Primary School, Bleckley County Elementary School, and Bleckley Middle School.
Ownership History
Date
Name
Owned For
Owner Type
Purchase Details
Closed on
Mar 29, 2011
Sold by
Butler Chris W
Bought by
Manning Ruby
Current Estimated Value
Purchase Details
Closed on
May 6, 2009
Sold by
Butler Chris W
Bought by
Manning Ruby
Home Financials for this Owner
Home Financials are based on the most recent Mortgage that was taken out on this home.
Original Mortgage
$10,780
Interest Rate
4.89%
Mortgage Type
Future Advance Clause Open End Mortgage
Purchase Details
Closed on
Jun 12, 2006
Sold by
Lyles Tommy E
Bought by
Manning Ruby
Purchase Details
Closed on
Apr 18, 2005
Sold by
Dye Belinda D
Bought by
Manning Ruby
Purchase Details
Closed on
Jul 28, 2003
Sold by
Brown Karl M
Bought by
Dye Belinda D
Purchase Details
Closed on
Jun 7, 2001
Sold by
Brown James M F
Bought by
Brown Karl M
Purchase Details
Closed on
Nov 17, 1998
Sold by
The Dykes Company In
Bought by
Brown James M F
Create a Home Valuation Report for This Property
The Home Valuation Report is an in-depth analysis detailing your home's value as well as a comparison with similar homes in the area
Home Values in the Area
Average Home Value in this Area
Purchase History
| Date | Buyer | Sale Price | Title Company |
|---|---|---|---|
| Manning Ruby | $1,000 | -- | |
| Manning Ruby | $20,500 | -- | |
| Manning Ruby | $17,534 | -- | |
| Manning Ruby | $9,500 | -- | |
| Dye Belinda D | $6,000 | -- | |
| Brown Karl M | $3,000 | -- | |
| Brown James M F | $6,000 | -- |
Source: Public Records
Mortgage History
| Date | Status | Borrower | Loan Amount |
|---|---|---|---|
| Previous Owner | Manning Ruby | $10,780 |
Source: Public Records
Tax History Compared to Growth
Tax History
| Year | Tax Paid | Tax Assessment Tax Assessment Total Assessment is a certain percentage of the fair market value that is determined by local assessors to be the total taxable value of land and additions on the property. | Land | Improvement |
|---|---|---|---|---|
| 2024 | $1,993 | $76,520 | $3,520 | $73,000 |
| 2023 | $2,068 | $76,520 | $3,520 | $73,000 |
| 2022 | $1,789 | $67,760 | $3,520 | $64,240 |
| 2021 | $1,445 | $51,640 | $3,520 | $48,120 |
| 2020 | $1,445 | $51,640 | $3,520 | $48,120 |
| 2019 | $1,458 | $51,989 | $4,576 | $47,413 |
| 2018 | $1,529 | $51,989 | $4,576 | $47,413 |
| 2017 | $1,469 | $51,989 | $4,576 | $47,413 |
| 2016 | $1,470 | $51,989 | $4,576 | $47,413 |
| 2015 | -- | $51,989 | $4,576 | $47,413 |
| 2014 | -- | $51,989 | $4,576 | $47,413 |
| 2013 | -- | $51,989 | $4,576 | $47,413 |
Source: Public Records
Map
Nearby Homes
- 140 Racetrack Dr
- 112 Pecan St
- 118 Pecan St
- 116 Pecan St
- 134 Easy St
- 115 Plantation Dr
- 0 Willow Creek Run
- 142 Rose St
- 116 W Lewis St
- RV Park Mac Thompson Rd
- Land Mac Thompson Rd
- 1277 Georgia 112
- 406 Mac Thompson Rd
- 119 S 4th St
- 118 S 5th St
- 119 Moll Dr
- 123 S 5th St
- 0 Tiffany Dr Unit 10525322
- 150 Wood Oak Cir
- 124 Pine Hill Dr
- 109 Limestone Landing
- 109 Limestone Landing
- 140 Jockey Ln
- 8 Limestone Landing Unit 8A
- 8 Limestone Landing
- 105 Limestone Landing
- 145 Limestone Rd
- 136 Jockey Ln
- 141 Jockey Ln
- 191 Evergreen Dr
- 0 Jockey Ln Unit Lot 30 8101738
- 0 Jockey Ln Unit 8799288
- 128 Jockey Ln
- 146 Limestone Rd
- 168 Jessup St
- 159 Jockey Ln
- 184 Limestone Rd
- 165 Jessup St
- 172 Jessup St
- 117 Jockey Ln