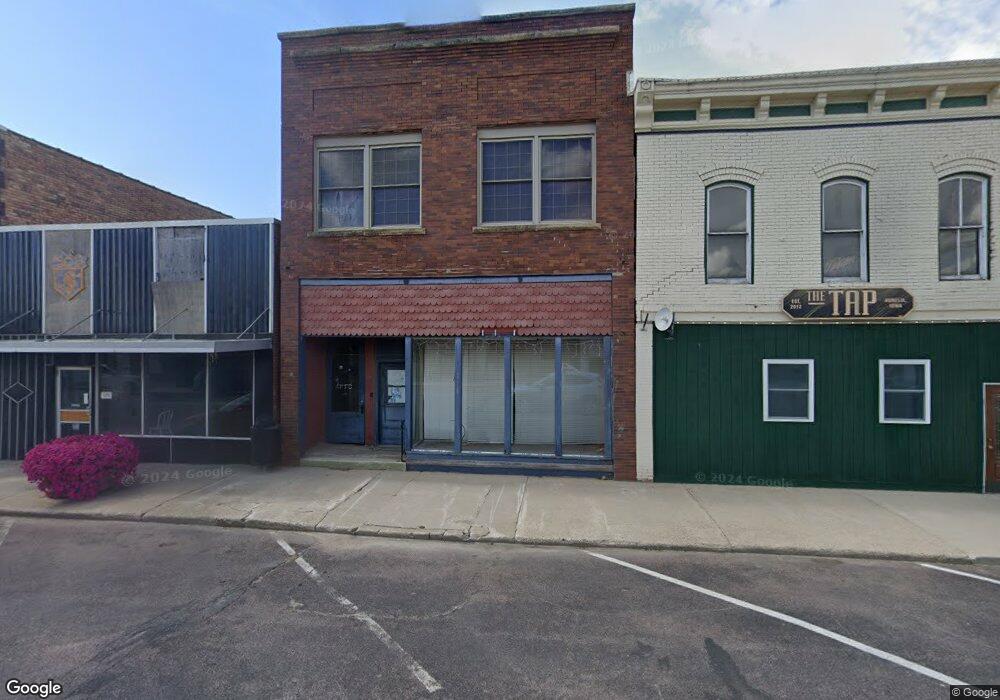
113 Main St Aurelia, IA 51005
Estimated Value: $43,604
--
Bed
--
Bath
2,500
Sq Ft
$17/Sq Ft
Est. Value
About This Home
This home is located at 113 Main St, Aurelia, IA 51005 and is currently estimated at $43,604, approximately $17 per square foot. 113 Main St is a home located in Cherokee County with nearby schools including Aurelia Elementary, Alta-Aurelia Middle School, and Alta Aurelia High School.
Ownership History
Date
Name
Owned For
Owner Type
Purchase Details
Closed on
May 15, 2019
Sold by
Roberts Noah K
Bought by
Johnson Jeromy and Mammen Keisha
Current Estimated Value
Home Financials for this Owner
Home Financials are based on the most recent Mortgage that was taken out on this home.
Original Mortgage
$6,000
Interest Rate
4%
Mortgage Type
Land Contract Argmt. Of Sale
Purchase Details
Closed on
Apr 25, 2019
Sold by
Roberts Noah K
Bought by
Johnson Jeromy and Mammen Keisha
Home Financials for this Owner
Home Financials are based on the most recent Mortgage that was taken out on this home.
Original Mortgage
$6,000
Interest Rate
4%
Mortgage Type
Land Contract Argmt. Of Sale
Purchase Details
Closed on
Oct 21, 2005
Sold by
Roberts Michael
Bought by
Roberts Kingsleigh R
Create a Home Valuation Report for This Property
The Home Valuation Report is an in-depth analysis detailing your home's value as well as a comparison with similar homes in the area
Home Values in the Area
Average Home Value in this Area
Purchase History
| Date | Buyer | Sale Price | Title Company |
|---|---|---|---|
| Johnson Jeromy | $32,474 | None Available | |
| Johnson Jeromy | $32,500 | None Available | |
| Johnson Jeromy | -- | None Available | |
| Roberts Kingsleigh R | $30,000 | None Available |
Source: Public Records
Mortgage History
| Date | Status | Borrower | Loan Amount |
|---|---|---|---|
| Previous Owner | Johnson Jeromy | $6,000 |
Source: Public Records
Tax History Compared to Growth
Tax History
| Year | Tax Paid | Tax Assessment Tax Assessment Total Assessment is a certain percentage of the fair market value that is determined by local assessors to be the total taxable value of land and additions on the property. | Land | Improvement |
|---|---|---|---|---|
| 2025 | $594 | $48,840 | $2,660 | $46,180 |
| 2024 | $594 | $43,760 | $2,660 | $41,100 |
| 2023 | $568 | $43,760 | $2,660 | $41,100 |
| 2022 | $2,570 | $35,260 | $2,660 | $32,600 |
| 2021 | $1,835 | $35,260 | $2,660 | $32,600 |
| 2020 | $812 | $35,260 | $2,660 | $32,600 |
| 2019 | $908 | $39,772 | $0 | $0 |
| 2018 | $728 | $31,732 | $0 | $0 |
| 2017 | $716 | $18,405 | $0 | $0 |
| 2016 | $736 | $31,732 | $0 | $0 |
| 2015 | $818 | $33,776 | $0 | $0 |
| 2014 | $864 | $33,776 | $0 | $0 |
Source: Public Records
Map
Nearby Homes