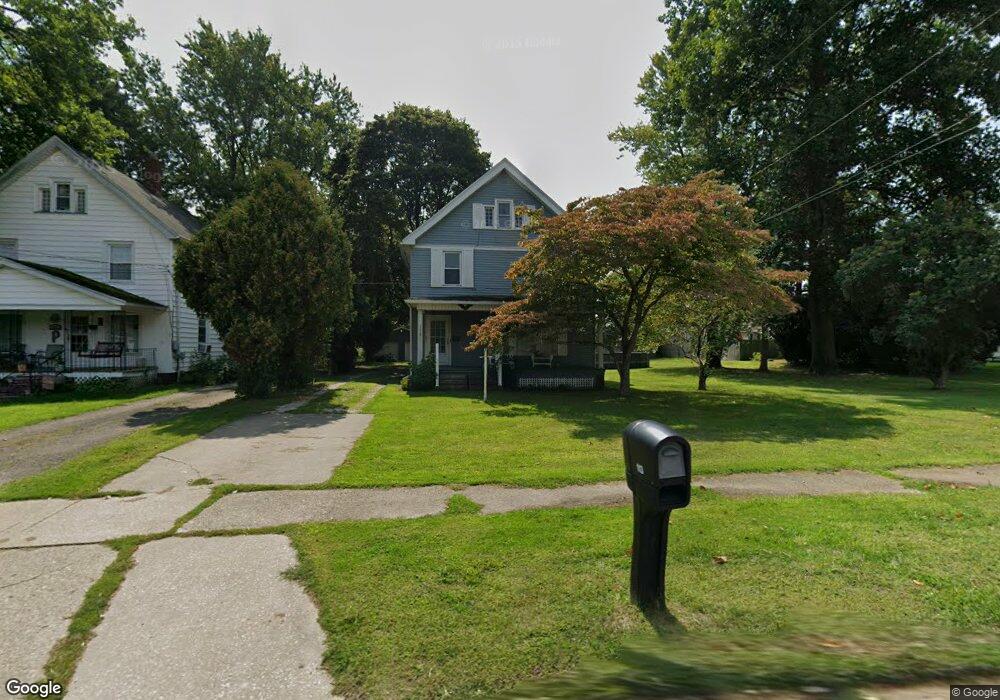
113 Main St Conneaut, OH 44030
Estimated Value: $138,000 - $168,000
4
Beds
2
Baths
1,616
Sq Ft
$97/Sq Ft
Est. Value
About This Home
This home is located at 113 Main St, Conneaut, OH 44030 and is currently estimated at $156,360, approximately $96 per square foot. 113 Main St is a home located in Ashtabula County with nearby schools including Lakeshore Primary Elementary School, Gateway Elementary School, and Conneaut Middle School.
Ownership History
Date
Name
Owned For
Owner Type
Purchase Details
Closed on
Oct 30, 2017
Sold by
Hart Jeremy P and Hart Michelle L
Bought by
Hart Jeremy P
Current Estimated Value
Home Financials for this Owner
Home Financials are based on the most recent Mortgage that was taken out on this home.
Original Mortgage
$95,060
Outstanding Balance
$79,844
Interest Rate
3.94%
Mortgage Type
New Conventional
Estimated Equity
$76,516
Purchase Details
Closed on
Jul 15, 2008
Sold by
Endean Michael F and Endean Laura L
Bought by
Hart Jeremy P and Hart Michelle L
Home Financials for this Owner
Home Financials are based on the most recent Mortgage that was taken out on this home.
Original Mortgage
$111,631
Interest Rate
6.15%
Mortgage Type
Unknown
Purchase Details
Closed on
Apr 21, 1995
Sold by
Merlene Russell D
Bought by
Endean Michael F and Endean Laura L
Home Financials for this Owner
Home Financials are based on the most recent Mortgage that was taken out on this home.
Original Mortgage
$52,250
Interest Rate
8.64%
Mortgage Type
New Conventional
Create a Home Valuation Report for This Property
The Home Valuation Report is an in-depth analysis detailing your home's value as well as a comparison with similar homes in the area
Home Values in the Area
Average Home Value in this Area
Purchase History
| Date | Buyer | Sale Price | Title Company |
|---|---|---|---|
| Hart Jeremy P | -- | Title Source Inc | |
| Hart Jeremy P | $106,000 | Chicago Title | |
| Endean Michael F | $55,000 | -- |
Source: Public Records
Mortgage History
| Date | Status | Borrower | Loan Amount |
|---|---|---|---|
| Open | Hart Jeremy P | $95,060 | |
| Closed | Hart Jeremy P | $111,631 | |
| Closed | Endean Michael F | $52,250 |
Source: Public Records
Tax History Compared to Growth
Tax History
| Year | Tax Paid | Tax Assessment Tax Assessment Total Assessment is a certain percentage of the fair market value that is determined by local assessors to be the total taxable value of land and additions on the property. | Land | Improvement |
|---|---|---|---|---|
| 2024 | $3,031 | $41,440 | $5,460 | $35,980 |
| 2023 | $1,924 | $41,440 | $5,460 | $35,980 |
| 2022 | $1,629 | $30,870 | $4,200 | $26,670 |
| 2021 | $1,657 | $30,870 | $4,200 | $26,670 |
| 2020 | $1,656 | $30,870 | $4,200 | $26,670 |
| 2019 | $1,578 | $28,880 | $2,210 | $26,670 |
| 2018 | $1,504 | $28,880 | $2,210 | $26,670 |
| 2017 | $1,502 | $28,880 | $2,210 | $26,670 |
| 2016 | $1,443 | $30,240 | $2,310 | $27,930 |
| 2015 | $1,458 | $30,240 | $2,310 | $27,930 |
| 2014 | $2,630 | $30,240 | $2,310 | $27,930 |
| 2013 | $1,276 | $30,910 | $3,430 | $27,480 |
Source: Public Records
Map
Nearby Homes
- 210 W Main Rd
- 855 Spring St Unit S9
- 202 W Main Rd Unit 49
- 202 W Main Rd Unit Lot 150
- 202 W Main Rd Unit 33
- 202 W Main Rd Unit 16
- 247 Whitney St
- 220 Daniels Ave
- 0 Hillcrest Ct
- 18 Hillcrest Ct
- 589 Main St
- VL Center Rd
- 536 Madison St
- 474 Sherman St
- 455 Main St
- 251 St Rt 7
- 1145 Lake Rd
- 2663 Lake Rd
- 1150 Lake Rd
- 57 Eaton Dr