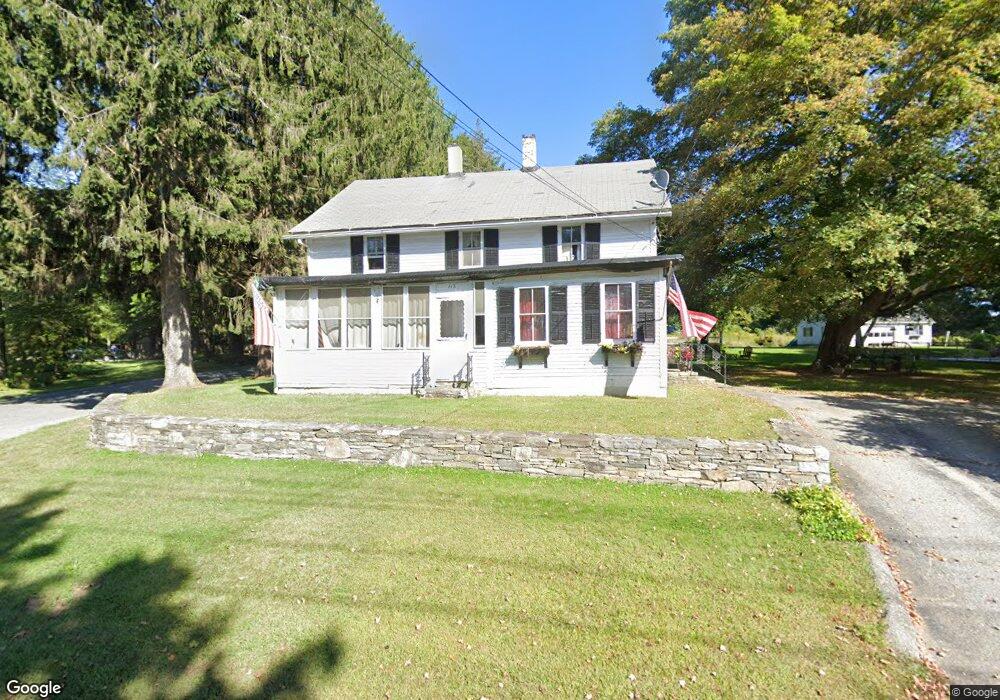
113 Mantup Rd Putnam, CT 06260
Estimated Value: $422,605 - $474,000
5
Beds
2
Baths
2,450
Sq Ft
$182/Sq Ft
Est. Value
About This Home
This home is located at 113 Mantup Rd, Putnam, CT 06260 and is currently estimated at $445,151, approximately $181 per square foot. 113 Mantup Rd is a home located in Windham County with nearby schools including Putnam Elementary School, Putnam Middle School, and Putnam High School.
Ownership History
Date
Name
Owned For
Owner Type
Purchase Details
Closed on
Jan 7, 2010
Sold by
Viens Robert G
Bought by
Viens Marieanne
Current Estimated Value
Home Financials for this Owner
Home Financials are based on the most recent Mortgage that was taken out on this home.
Original Mortgage
$105,000
Outstanding Balance
$68,341
Interest Rate
4.78%
Estimated Equity
$376,810
Create a Home Valuation Report for This Property
The Home Valuation Report is an in-depth analysis detailing your home's value as well as a comparison with similar homes in the area
Home Values in the Area
Average Home Value in this Area
Purchase History
| Date | Buyer | Sale Price | Title Company |
|---|---|---|---|
| Viens Marieanne | $100,000 | -- |
Source: Public Records
Mortgage History
| Date | Status | Borrower | Loan Amount |
|---|---|---|---|
| Open | Viens Marieanne | $105,000 | |
| Previous Owner | Viens Marieanne | $95,000 | |
| Previous Owner | Viens Marieanne | $25,000 |
Source: Public Records
Tax History
| Year | Tax Paid | Tax Assessment Tax Assessment Total Assessment is a certain percentage of the fair market value that is determined by local assessors to be the total taxable value of land and additions on the property. | Land | Improvement |
|---|---|---|---|---|
| 2025 | $4,338 | $229,500 | $45,700 | $183,800 |
| 2024 | $5,536 | $220,200 | $45,300 | $174,900 |
| 2023 | $3,598 | $154,500 | $36,000 | $118,500 |
| 2022 | $3,428 | $154,500 | $36,000 | $118,500 |
| 2021 | $3,374 | $154,500 | $36,000 | $118,500 |
| 2020 | $3,374 | $154,500 | $36,000 | $118,500 |
| 2019 | $2,782 | $149,200 | $48,400 | $100,800 |
| 2018 | $2,702 | $148,500 | $48,400 | $100,100 |
| 2017 | $2,606 | $148,500 | $48,400 | $100,100 |
| 2016 | $2,679 | $148,500 | $48,400 | $100,100 |
| 2015 | $2,587 | $148,500 | $48,400 | $100,100 |
| 2014 | $2,568 | $159,800 | $55,100 | $104,700 |
Source: Public Records
Map
Nearby Homes
- 839 Wrights Crossing Rd
- 219 Pomfret St
- 228 River Rd
- 224 Pomfret St
- 50 Richmond Rd Unit 10
- 33 Chapman St
- 216 Sabin St
- 16 Wilkinson St
- 25 Seward St
- 95 Underwood Rd
- 9 Hammond St
- 6 Prospect St
- 29 Bellevue St
- 26 King St
- 115 Grove St
- 29 Prospect St Unit A
- 132 Grove St
- 24 Tatem St
- 136 Church St
- 23 Pine Crest Ridge
Your Personal Tour Guide
Ask me questions while you tour the home.