Estimated Value: $126,000 - $187,000
About This Home
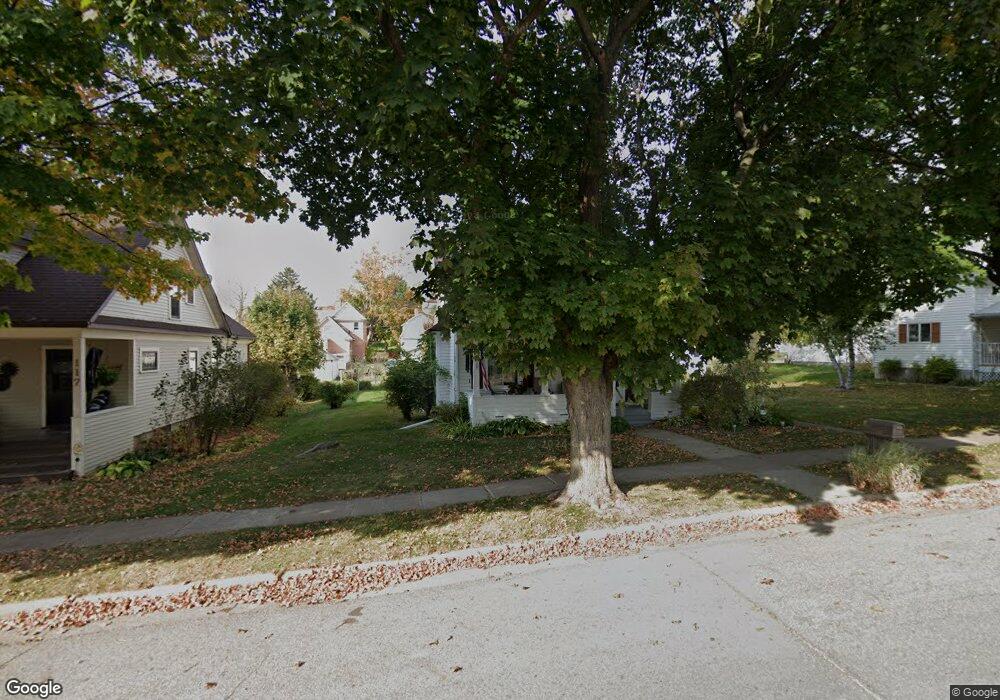
This home is located at 113 Maple St N, Mabel, MN 55954 and is currently estimated at $164,651, approximately $109 per square foot. 113 Maple St N is a home located in Fillmore County with nearby schools including Mabel-Canton Elementary School and Mabel-Canton Secondary School.
Ownership History
We collect this data history from publicly available records. To have your information removed, we recommend requesting removal directly through your county’s website.
Purchase Details
Purchase Details
Home Financials for this Owner
Home Financials are based on the most recent Mortgage that was taken out on this home.Purchase Details
Home Financials for this Owner
Home Financials are based on the most recent Mortgage that was taken out on this home.Purchase History
We collect this data history from publicly available records. To have your information removed, we recommend requesting removal directly through your county’s website.
| Date | Buyer | Sale Price | Title Company |
|---|---|---|---|
| $122,500 | None Available | ||
| $113,000 | -- | ||
| $88,500 | None Available | ||
| $122,500 | -- |
Mortgage History
We collect this data history from publicly available records. To have your information removed, we recommend requesting removal directly through your county’s website.
| Date | Status | Borrower | Loan Amount |
|---|---|---|---|
| Previous Owner | $90,400 | ||
| Previous Owner | $70,300 | ||
| Closed | $122,500 |
Tax History
We collect this data history from publicly available records. To have your information removed, we recommend requesting removal directly through your county’s website.
| Year | Tax Paid | Tax Assessment Tax Assessment Total Assessment is a certain percentage of the fair market value that is determined by local assessors to be the total taxable value of land and additions on the property. | Land | Improvement |
|---|---|---|---|---|
| 2025 | $1,876 | $135,000 | $15,000 | $120,000 |
| 2024 | $1,378 | $114,100 | $15,000 | $99,100 |
| 2023 | $1,470 | $114,100 | $15,000 | $99,100 |
| 2022 | $1,470 | $97,200 | $15,000 | $82,200 |
| 2021 | $1,470 | $94,400 | $12,200 | $82,200 |
| 2020 | $1,266 | $94,400 | $12,200 | $82,200 |
| 2019 | $1,214 | $80,400 | $12,200 | $68,200 |
| 2018 | $1,178 | $80,400 | $12,200 | $68,200 |
| 2017 | -- | $79,000 | $12,200 | $66,800 |
| 2016 | $1,142 | $72,200 | $12,200 | $60,000 |
| 2015 | $1,228 | $46,100 | $7,352 | $38,748 |
| 2014 | $1,228 | $42,800 | $7,323 | $35,477 |
| 2013 | $1,228 | $51,400 | $7,713 | $43,687 |
Map
- 315 W Fillmore
- 315 Newburg Ave W
- 305 E Fillmore
- TBD County 8
- TBD-C County 8
- 12994 385th Ave
- Cardinal Ln
- TBD Cardinal Ln
- 1905 337th St
- Tbd Middle Hesper Rd
- 232 1st Ave SW
- 39739 Dragonfly Trail
- 3357 Locust Rd
- 147 4th Ave SE
- 36349 146th St
- TBD Middle Hesper Rd
- 3251 110th Ave
- 40698 Chestnut Rd
- 348 7th Ave SE
- 3rd Se Ave
- 105 Maple St N
- 109 Maple St N
- 101 Maple St N
- 108 S Oak St
- 101 Maple St S
- 104 Oak St N
- 112 Oak St N
- 121 Maple St N
- 114 Maple St N
- 106 Maple St N
- 110 Maple St N
- 102 Maple St N
- 105 Maple St S
- 116 Oak St N
- 102 S Maple St
- 208 W Fillmore Ave
- 122 Maple St N
- 109 Maple St S
- 106 Newburg Ave W
- 108 W Fillmore Ave
Ask me questions while you tour the home.