Estimated Value: $136,463 - $178,000
3
Beds
2
Baths
1,200
Sq Ft
$129/Sq Ft
Est. Value
About This Home
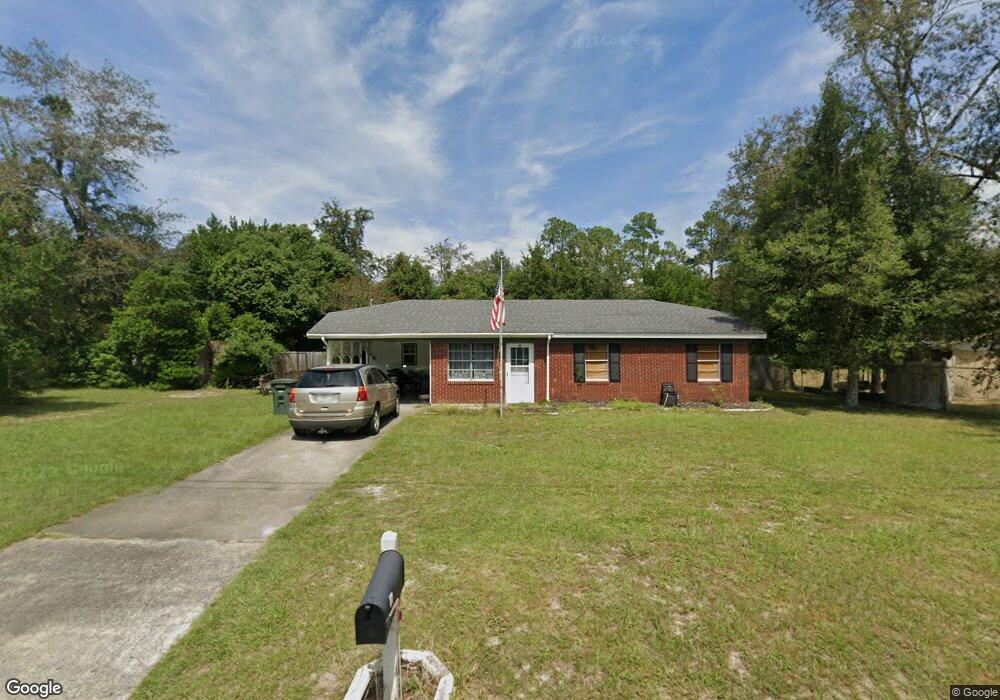
This home is located at 113 Mayfair Rd, Jesup, GA 31546 and is currently estimated at $155,366, approximately $129 per square foot. 113 Mayfair Rd is a home located in Wayne County with nearby schools including Jesup Elementary School, Arthur Williams Middle School, and Wayne County High School.
Ownership History
Date
Name
Owned For
Owner Type
Purchase Details
Closed on
Feb 19, 2021
Sold by
Mort Keith A
Bought by
Border Jerrod M and Border Dannette Jane
Current Estimated Value
Home Financials for this Owner
Home Financials are based on the most recent Mortgage that was taken out on this home.
Original Mortgage
$68,250
Outstanding Balance
$61,042
Interest Rate
2.7%
Mortgage Type
New Conventional
Estimated Equity
$94,324
Purchase Details
Closed on
Feb 28, 2018
Sold by
Bell Ora Lee
Bought by
Mort Keith A and Mort Beverly A
Home Financials for this Owner
Home Financials are based on the most recent Mortgage that was taken out on this home.
Original Mortgage
$56,000
Interest Rate
4.22%
Mortgage Type
New Conventional
Purchase Details
Closed on
Feb 1, 1982
Bought by
Bell Ora Lee
Purchase Details
Closed on
Jul 1, 1978
Purchase Details
Closed on
Feb 1, 1975
Purchase Details
Closed on
Oct 1, 1974
Purchase Details
Closed on
Mar 1, 1974
Purchase Details
Closed on
Oct 1, 1971
Purchase Details
Closed on
Mar 1, 1971
Create a Home Valuation Report for This Property
The Home Valuation Report is an in-depth analysis detailing your home's value as well as a comparison with similar homes in the area
Home Values in the Area
Average Home Value in this Area
Purchase History
| Date | Buyer | Sale Price | Title Company |
|---|---|---|---|
| Border Jerrod M | $91,000 | -- | |
| Mort Keith A | $70,000 | -- | |
| Bell Ora Lee | -- | -- | |
| -- | -- | -- | |
| -- | -- | -- | |
| -- | -- | -- | |
| -- | -- | -- | |
| -- | -- | -- | |
| -- | -- | -- |
Source: Public Records
Mortgage History
| Date | Status | Borrower | Loan Amount |
|---|---|---|---|
| Open | Border Jerrod M | $68,250 | |
| Previous Owner | Mort Keith A | $56,000 |
Source: Public Records
Tax History Compared to Growth
Tax History
| Year | Tax Paid | Tax Assessment Tax Assessment Total Assessment is a certain percentage of the fair market value that is determined by local assessors to be the total taxable value of land and additions on the property. | Land | Improvement |
|---|---|---|---|---|
| 2024 | $1,319 | $43,128 | $3,400 | $39,728 |
| 2023 | $1,355 | $38,304 | $3,400 | $34,904 |
| 2022 | $993 | $31,551 | $3,400 | $28,151 |
| 2021 | $335 | $25,600 | $3,400 | $22,200 |
| 2020 | $349 | $25,600 | $3,400 | $22,200 |
| 2019 | $369 | $25,600 | $3,400 | $22,200 |
| 2018 | $920 | $25,600 | $3,400 | $22,200 |
| 2017 | $792 | $25,600 | $3,400 | $22,200 |
| 2016 | $246 | $25,600 | $3,400 | $22,200 |
| 2014 | $245 | $25,600 | $3,400 | $22,200 |
| 2013 | -- | $25,600 | $3,400 | $22,200 |
Source: Public Records
Map
Nearby Homes
- 945 S Palm St
- 985 Seven Oaks Rd
- 805 Littlefield St
- 1101 S Palm St
- 775 Catherine St
- 50 Ac Hwy 301
- 1300 S Palm St
- 123 Ivy St
- 655 Littlefield St
- 0 S Palm St Unit 10609054
- 0 S Palm St Unit 1656795
- 158 N Deborah Cir
- 00 U S 301
- 1312 E Plum St
- 555 E Magnolia St
- 210 Purser Dr
- 0 Us Hwy 341 Hwy S Unit 1651906
- 661 E Plum St
- 0 Us Hwy 341 S
- 412 E Orange St
- 115 Mayfair Rd
- 111 Mayfair Rd
- 118 Berkley Dr
- 112 Berkley Dr
- 200 Berkley Dr
- 107 Mayfair Rd
- 112 Mayfair Rd
- 106 Berkley Dr
- 110 Mayfair Rd
- 129 Berkley Dr
- 127 Berkley Dr
- 202 Berkley Dr
- 131 Berkley Dr
- 108 Mayfair Rd
- 125 Berkley Dr
- 949 Seven Oaks Rd
- 943 Seven Oaks Rd
- 115 Lynton Rd
- 133 Berkley Dr
- 123 Berkley Dr