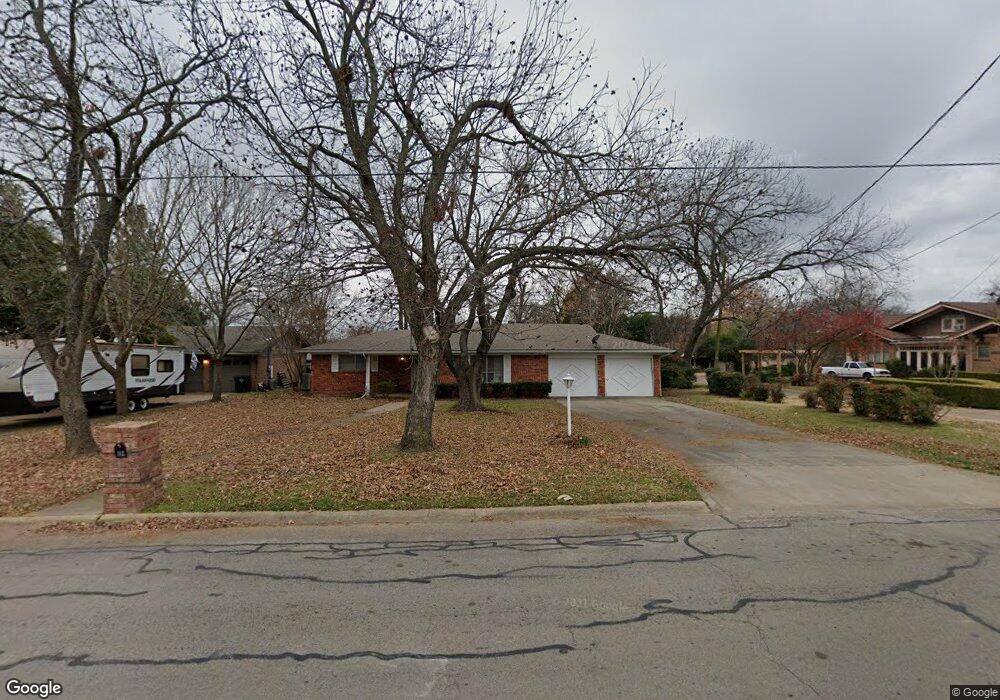
113 Mcanear St Cleburne, TX 76033
Estimated Value: $203,013 - $271,000
3
Beds
2
Baths
1,717
Sq Ft
$136/Sq Ft
Est. Value
About This Home
This home is located at 113 Mcanear St, Cleburne, TX 76033 and is currently estimated at $233,253, approximately $135 per square foot. 113 Mcanear St is a home located in Johnson County with nearby schools including Marti Elementary School, A.D. Wheat Middle School, and Cleburne High School.
Ownership History
Date
Name
Owned For
Owner Type
Purchase Details
Closed on
Mar 29, 2018
Sold by
Morris Wendell
Bought by
Shafique Salma
Current Estimated Value
Home Financials for this Owner
Home Financials are based on the most recent Mortgage that was taken out on this home.
Original Mortgage
$78,750
Outstanding Balance
$56,310
Interest Rate
4.38%
Mortgage Type
Purchase Money Mortgage
Estimated Equity
$176,943
Purchase Details
Closed on
Dec 29, 2016
Sold by
Patterson Holdings Llc
Bought by
Patterson Holdings Burleson Llc
Home Financials for this Owner
Home Financials are based on the most recent Mortgage that was taken out on this home.
Original Mortgage
$2,800,000
Interest Rate
3.94%
Mortgage Type
Purchase Money Mortgage
Purchase Details
Closed on
Feb 13, 2009
Sold by
Turner Donna Faye
Bought by
Morris Wendell
Create a Home Valuation Report for This Property
The Home Valuation Report is an in-depth analysis detailing your home's value as well as a comparison with similar homes in the area
Home Values in the Area
Average Home Value in this Area
Purchase History
| Date | Buyer | Sale Price | Title Company |
|---|---|---|---|
| Shafique Salma | -- | Stewart Title | |
| Patterson Holdings Burleson Llc | -- | None Available | |
| Morris Wendell | -- | Rtt |
Source: Public Records
Mortgage History
| Date | Status | Borrower | Loan Amount |
|---|---|---|---|
| Open | Shafique Salma | $78,750 | |
| Previous Owner | Patterson Holdings Burleson Llc | $2,800,000 |
Source: Public Records
Tax History Compared to Growth
Tax History
| Year | Tax Paid | Tax Assessment Tax Assessment Total Assessment is a certain percentage of the fair market value that is determined by local assessors to be the total taxable value of land and additions on the property. | Land | Improvement |
|---|---|---|---|---|
| 2025 | $2,558 | $110,928 | $38,500 | $72,428 |
| 2024 | $2,558 | $114,739 | $38,500 | $76,239 |
| 2023 | $2,553 | $114,739 | $38,500 | $76,239 |
| 2022 | $2,871 | $114,739 | $38,500 | $76,239 |
| 2021 | $2,994 | $114,739 | $38,500 | $76,239 |
| 2020 | $2,778 | $100,254 | $25,000 | $75,254 |
| 2019 | $2,962 | $100,254 | $25,000 | $75,254 |
| 2018 | $1,846 | $62,452 | $14,000 | $48,452 |
| 2017 | $1,838 | $62,452 | $14,000 | $48,452 |
| 2016 | $1,838 | $62,452 | $14,000 | $48,452 |
Source: Public Records
Map
Nearby Homes
- 111 Mcanear St
- 201 Mcanear St
- 1307 Chester St
- 109 Mcanear St
- 112 Mcanear St
- 203 Mcanear St
- 202 Mcanear St
- 107 Mcanear St
- 108 Mcanear St
- 1305 Chester St
- 1306 Chester St
- 205 Mcanear St
- 204 Mcanear St
- 106 Mcanear St
- 1304 Chester St
- 203 Adams St
- 1301 Chester St
- 1302 Chester St
- 1302 W Henderson St
- 107 Adams St