
Seller's Agent in 2024
Laura Danforth
William Raveis Real Estate
(203) 801-8001
35 in this area
39 Total Sales
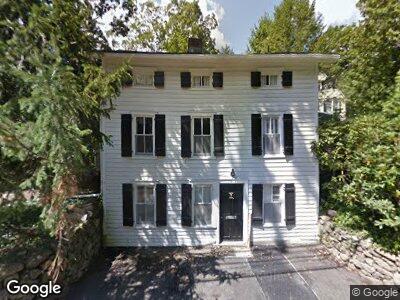
This extraordinary home, available in August, features an open floor plan that seamlessly connects the living room, dining area, and kitchen. The cast iron wood-burning stove will keep you warm and cozy all winter. The layout includes a first-floor master bedroom and bath, plus two additional bedrooms on the second floor, along with a finished lower level and first-floor laundry for your convenience. The sun-drenched living room offers stunning views of a large backyard and patio, perfect for relaxation and outdoor gatherings. Situated within walking distance to town, the train station, schools, and parks, you'll love the ease of having everything close by and enjoying scenic strolls on sidewalks that lead all the way to town.
| Date | Buyer | Sale Price | Title Company |
|---|---|---|---|
| Gammill Corey M | $365,000 | -- | |
| Gammill Corey M | $365,000 | -- |
| Date | Status | Borrower | Loan Amount |
|---|---|---|---|
| Open | Gammill Corey M | $275,000 | |
| Closed | Gammill Corey M | $0 |
| Date | Event | Price | Change | Sq Ft Price |
|---|---|---|---|---|
| 08/15/2024 08/15/24 | Rented | $4,200 | 0.0% | -- |
| 06/14/2024 06/14/24 | Under Contract | -- | -- | -- |
| 06/01/2024 06/01/24 | For Rent | $4,200 | +7.7% | -- |
| 09/01/2021 09/01/21 | Rented | $3,900 | -1.9% | -- |
| 08/19/2021 08/19/21 | Under Contract | -- | -- | -- |
| 08/14/2021 08/14/21 | Price Changed | $3,975 | -5.4% | $3 / Sq Ft |
| 06/29/2021 06/29/21 | For Rent | $4,200 | 0.0% | -- |
| 01/12/2012 01/12/12 | Sold | $365,000 | -23.2% | $312 / Sq Ft |
| 12/20/2011 12/20/11 | Pending | -- | -- | -- |
| 02/07/2011 02/07/11 | For Sale | $475,000 | -- | $406 / Sq Ft |
| Year | Tax Paid | Tax Assessment Tax Assessment Total Assessment is a certain percentage of the fair market value that is determined by local assessors to be the total taxable value of land and additions on the property. | Land | Improvement |
|---|---|---|---|---|
| 2024 | $9,528 | $590,310 | $475,860 | $114,450 |
| 2023 | $8,604 | $454,300 | $420,420 | $33,880 |
| 2022 | $8,345 | $454,300 | $420,420 | $33,880 |
| 2021 | $8,250 | $454,300 | $420,420 | $33,880 |
| 2020 | $8,250 | $454,300 | $420,420 | $33,880 |
| 2019 | $8,286 | $454,300 | $420,420 | $33,880 |
| 2018 | $5,670 | $322,000 | $278,810 | $43,190 |
| 2017 | $5,567 | $322,000 | $278,810 | $43,190 |
| 2016 | $5,441 | $322,000 | $278,810 | $43,190 |
| 2015 | $5,333 | $322,000 | $278,810 | $43,190 |
| 2014 | $5,185 | $322,000 | $278,810 | $43,190 |
Seller's Agent in 2024
Laura Danforth
William Raveis Real Estate
(203) 801-8001
35 in this area
39 Total Sales
A
Buyer's Agent in 2021
Ayesha Qureshi-Amin
Houlihan Lawrence
(203) 524-7559
1 in this area
34 Total Sales
Buyer's Agent in 2012
Barbara Shaw
Houlihan Lawrence
(203) 253-3878
17 in this area
24 Total Sales