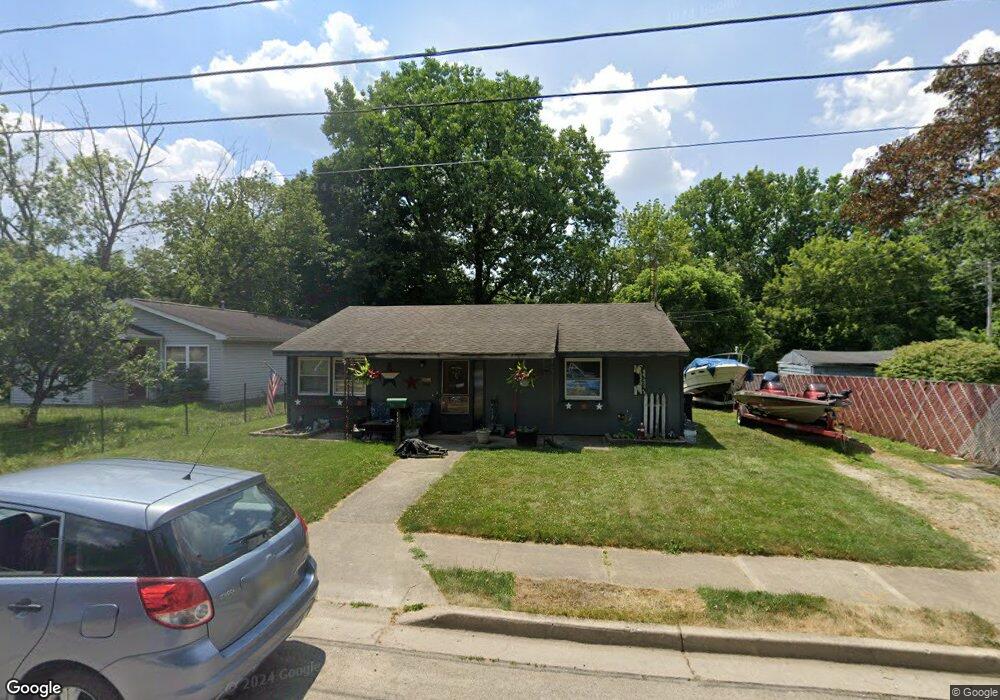
113 N Main St Covington, OH 45318
Estimated Value: $141,000 - $153,000
2
Beds
1
Bath
1,036
Sq Ft
$142/Sq Ft
Est. Value
About This Home
This home is located at 113 N Main St, Covington, OH 45318 and is currently estimated at $147,034, approximately $141 per square foot. 113 N Main St is a home located in Miami County with nearby schools including Covington Elementary/Junior High School, Covington Junior High School, and Covington High School.
Ownership History
Date
Name
Owned For
Owner Type
Purchase Details
Closed on
Aug 9, 2004
Sold by
Landis Nancy J
Bought by
Landis Mark A
Current Estimated Value
Purchase Details
Closed on
Jun 28, 2001
Sold by
Landis Nancy J and Landis Mark A
Bought by
Landis Mark A and Landis Nancy J
Purchase Details
Closed on
Jun 4, 1999
Sold by
Trust Of Earl Eichelberger
Bought by
Compton Nancy J and Landis Mark A
Home Financials for this Owner
Home Financials are based on the most recent Mortgage that was taken out on this home.
Original Mortgage
$52,000
Interest Rate
6.94%
Mortgage Type
New Conventional
Purchase Details
Closed on
Mar 1, 1983
Bought by
Weaver Janet Trustee
Create a Home Valuation Report for This Property
The Home Valuation Report is an in-depth analysis detailing your home's value as well as a comparison with similar homes in the area
Home Values in the Area
Average Home Value in this Area
Purchase History
| Date | Buyer | Sale Price | Title Company |
|---|---|---|---|
| Landis Mark A | -- | -- | |
| Landis Mark A | -- | -- | |
| Compton Nancy J | $65,000 | -- | |
| Weaver Janet Trustee | -- | -- |
Source: Public Records
Mortgage History
| Date | Status | Borrower | Loan Amount |
|---|---|---|---|
| Previous Owner | Compton Nancy J | $52,000 |
Source: Public Records
Tax History
| Year | Tax Paid | Tax Assessment Tax Assessment Total Assessment is a certain percentage of the fair market value that is determined by local assessors to be the total taxable value of land and additions on the property. | Land | Improvement |
|---|---|---|---|---|
| 2024 | $1,464 | $34,060 | $11,200 | $22,860 |
| 2023 | $1,276 | $34,060 | $11,200 | $22,860 |
| 2022 | $1,273 | $34,060 | $11,200 | $22,860 |
| 2021 | $1,056 | $26,180 | $8,610 | $17,570 |
| 2020 | $1,059 | $26,180 | $8,610 | $17,570 |
| 2019 | $1,063 | $26,180 | $8,610 | $17,570 |
| 2018 | $951 | $23,350 | $6,690 | $16,660 |
| 2017 | $967 | $23,350 | $6,690 | $16,660 |
| 2016 | $955 | $23,350 | $6,690 | $16,660 |
| 2015 | $881 | $22,470 | $6,440 | $16,030 |
| 2014 | $881 | $22,470 | $6,440 | $16,030 |
| 2013 | $848 | $22,470 | $6,440 | $16,030 |
Source: Public Records
Map
Nearby Homes
Your Personal Tour Guide
Ask me questions while you tour the home.